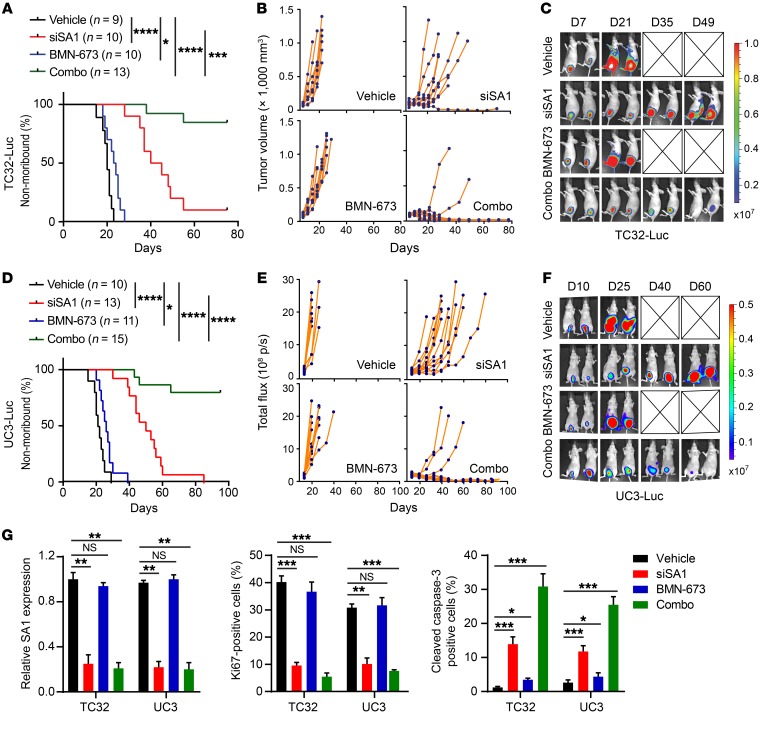
Figure 9. SA1 depletion sensitizes SA2-mutated tumors to the treatment of the PARP inhibitor BMN-673.
(A–F) Kaplan-Meier survival curves (A and D), individual tumor growth curves (B and E), and representative bioluminescent images (C and F) of xenograft tumors derived from orthotopically implanted TC32 (A–C) or UC3 (D–F) cells. Once tumor was established, mice were randomly divided into 4 groups and then treated with DMSO and control siRNA, siSA1 nanoliposome (twice weekly), BMN-673 (daily), or a combination of siSA1-DOPC nanoliposome and BMN-673. (G) Quantification of SA1 KD efficiency, cell proliferation (Ki-67 staining), and apoptosis (cleaved caspase-3 staining) in the xenografted tumor tissues described above. *P < 0.05; **P < 0.01; ***P < 0.001; ****P < 0.0001, log-rank Mantel-Cox test (A and D) and unpaired 2-tailed t test (G). Data are representative of 2 independent experiments and are presented as mean ± SD.

