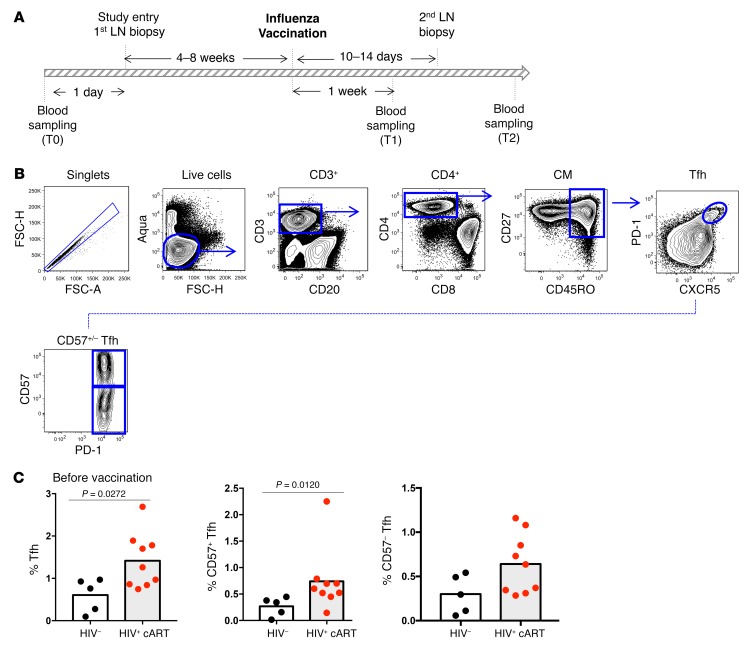
Figure 1. HIV+ LNs harbor higher frequencies of Tfh cells before vaccination compared with HC LNs.
(A) Schematic of study sampling. (B) Gating strategy used for Tfh cell characterization in LN cell suspensions using flow cytometry. (C) Pooled data showing the frequency of Tfh cells before vaccination in HCs (n = 5) and HIV+ LNs (n = 9). Data represent mean values unless indicated otherwise. The Mann-Whitney test was used for statistical analysis.

