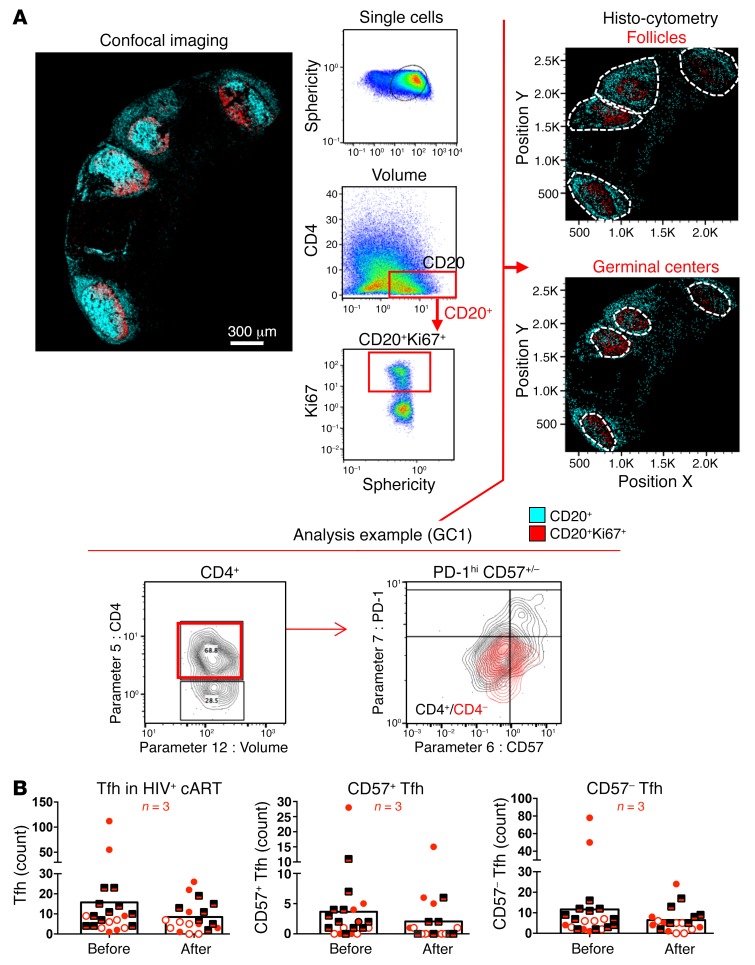
Figure 7. Generalized loss of Tfh cells after vaccination.
(A) Gating strategy for CD4+ phenotyping in tissues using histocytometry. For the analysis, tissues were stained with anti-CD20 and anti-Ki67 for B cell follicle characterization as well as anti–PD-1, CD57, and CD4 for Tfh cells. The nuclear marker JOJO-1 was also included in the analysis to aid with computational cell segmentation. Confocal images were transformed to FlowJo files as previously described, and Tfh cell frequencies within individual GCs were calculated using FlowJo, as per the analysis example. GCs were defined by gating onto Ki67+ rich areas of high or dim CD20 expression before calculating the absolute numbers of Tfh cells within each GC gate. Original magnification, ×40 (NA 1.3). (B) Pooled data of Tfh cell numbers within the GCs from 3 HIV+ donor LNs. Each symbol corresponds to an individual donor. Matched pre- and postvaccination data are presented for each donor. Different GCs within each donor’s tissue are represented by repeating the corresponding symbols.

