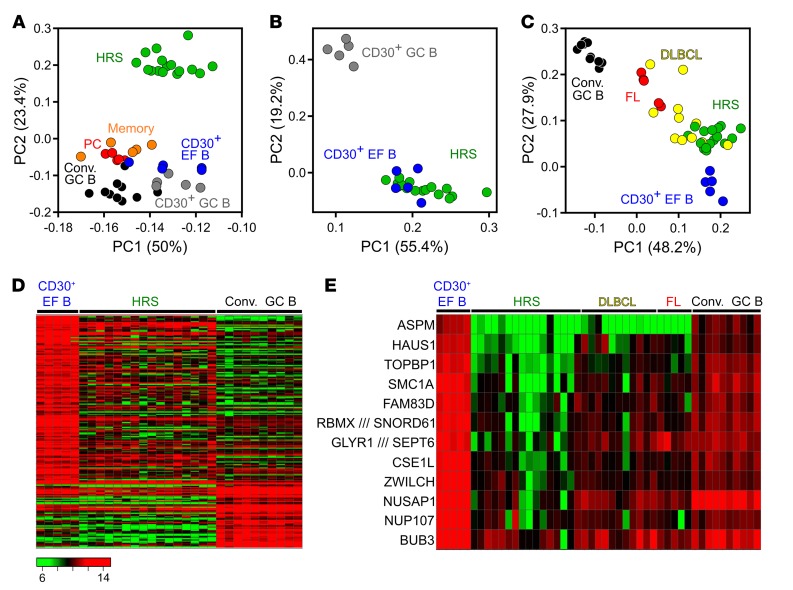
Figure 4. PCA and heat maps of the comparison of HRS cells to CD30+ and CD30– B cells.
(A) Unsupervised 2D PCA of probe sets with a SD > 1 (765 probe sets) from the comparison of HRS cells to normal GC and post-GC B cell subsets. (B) Supervised PCA of CD30+ B cells versus HRS cells, based on genes differentially expressed between CD30+ GC and CD30+ EF B cells (254 probe sets; FC ≥ 2, FDR ≤ 0.05). (C) Two-dimensional PCA based on probe sets at least 4-fold differentially expressed between CD30+ EF and conventional (Conv.) GC B cells (70 probe sets). Besides these 2 normal B cell subsets, HRS cell samples as well as FL and DLBCL are displayed. (D) Heat map of a supervised analysis of genes differentially expressed between conventional GC B cells and CD30+ EF B cells (199 probe sets, FC ≥ 3). HRS cell samples are shown for comparison. (E) Heat map shows the expression of 12 of 169 genes downregulated at least 5-fold in HRS cells in comparison with CD30+ EF B cells that are involved in the regulation of the spindle apparatus, cytokinesis, and polyploidy. Samples of conventional GC B cells as well as of FL and DLBCL are included for comparison. Scale as in D.

