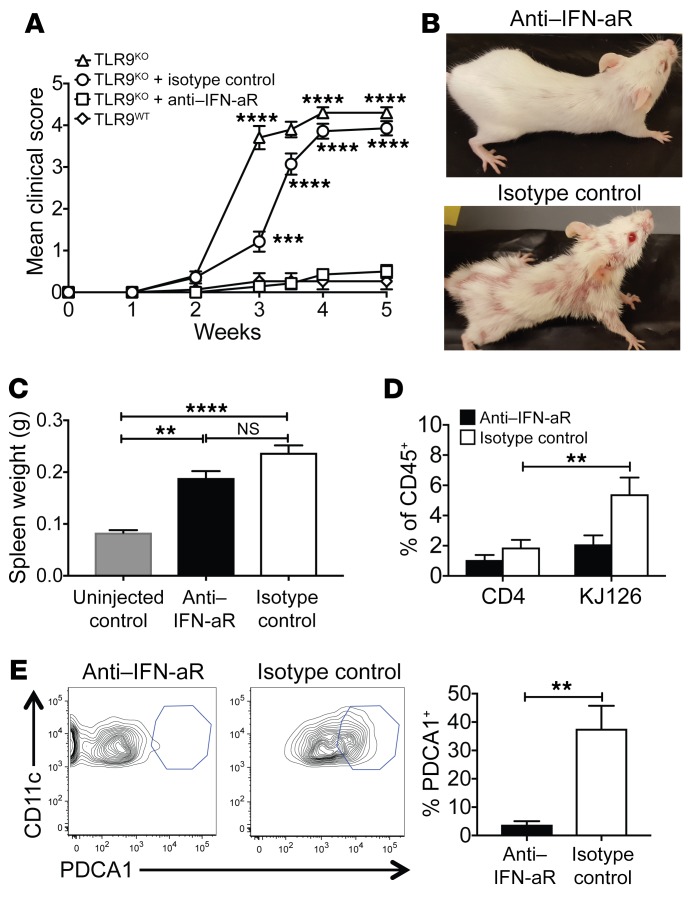
Figure 7. Type I IFN blockade abrogates skin disease in TLR9KO Ii-TGO mice.
(A) Development of skin disease in TLR9KO mice or TLR9KO mice treated with anti–IFN-aR mAb or isotype control mAb. (B) Representative images at 5 weeks after T cell injection. (C) Spleen weights of experimental and unmanipulated (no T cells or mAb) controls. (D) Percentages of CD4+ and CD4+KJ126+ cells in CD45+ skin cell gate. (E) Representative FACS plots and compiled data showing percentages of CD11c+PDCA1+ pDCs in CD45+CD11b–CD11c+ skin cell gate. Data are shown as mean ± SEM from 2 independent experiments and are representative of n = 6 mice per group. **P < 0.01; ***P < 0.001; ****P < 0.0001, 2-tailed Student’s t test and 2-way ANOVA with Šidák’s multiple-comparison test.

