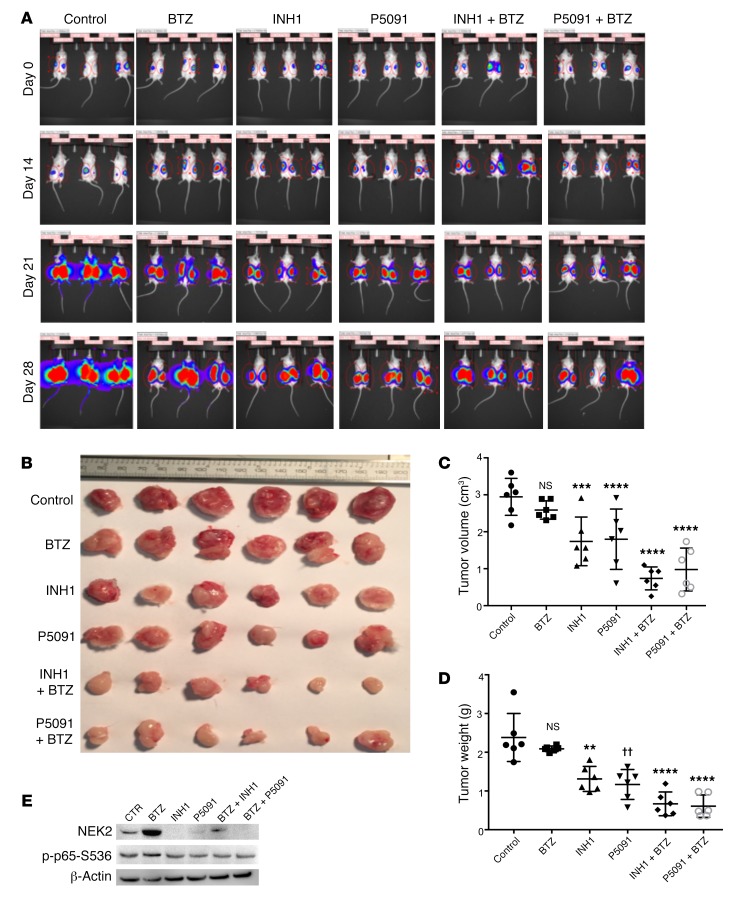
Figure 9. INH1 and P5091 overcomes NEK2-induced bortezomib resistance.
(A) Approximately 0.5 × 10⁶ NEK2-OE ARP1 cells expressing luciferase were injected subcutaneously in both left and right flanks of NOD-Rag1null mice. One week after injection of NEK2-OE cells, mice were treated with (i) vehicle, (ii) bortezomib (BTZ; 3 mg/kg, i.p., 2 times/week), (iii) INH1 (100 mg/kg, i.p., 3 times/week), (iv) P5091 (10 mg/kg, i.v., 2 times/week), (v) INH1 + BTZ, or (vii) P5091 + BTZ for 28 days. In vivo imaging showing the tumor growth in the different groups of mice before and after treatments at different time points. (B) Tumors from A were harvested and photographed. (C) Quantification of tumor volume from dissected tumors in B and Dunnett’s method was used to calculate the multiplicity-adjusted P values for each treatment and control group pair. ***P = 0.005; ****P = 0.0001. NS, no significance. (D) Quantification of tumor weight from dissected tumors in B and Dunnett’s method was used to calculate the multiplicity-adjusted P values for each treatment and control group pair. **P = 0.0032; ††P = 0.0052; ****P = 0.0001. NS, no significance. (E) Tumors from B were lysed and analyzed by Western blot using NEK2, p-p65-S536, and GAPDH antibodies.

