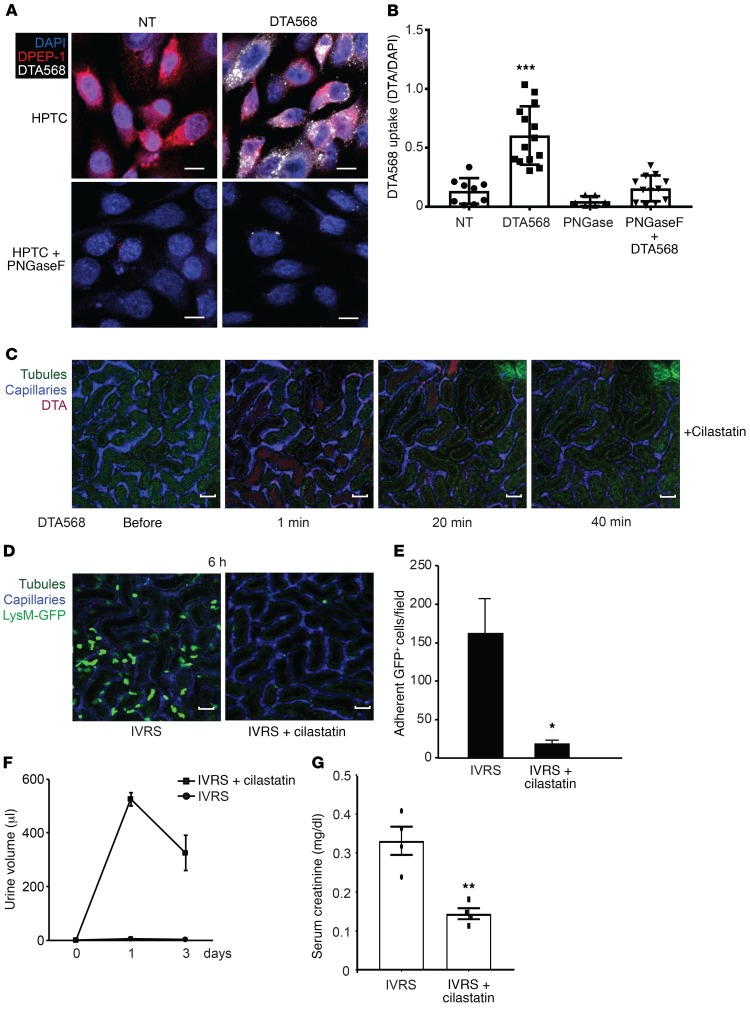
Figure 10. Renal DPEP-1 mediates tubular uptake of contrast from the urine.
(A and B) Contrast uptake (internalization) was imaged and quantified in human renal proximal TECs (HPTCs) using CF568-labeled DTA. PNGaseF was used to de-glycosylate DPEP-1 on HPTCs as a negative control. Scale bars: 10 μm. NT vs. CF568-DTA, ***P = 0.001, n = 9–14/group, ANOVA. (C) WT mice were treated with cilastatin prior to administration of CF568-DTA, and kidneys were imaged by multiphoton intravital microscopy over 40 minutes. Capillaries were labeled with Qtracker, and tubules are visualized by autofluorescence. Images are representative of 3 independent experiments. Scale bars: 100 μm. (D and E) LysM(gfp/gfp) mice were treated with cilastatin (25 mg/kg) or vehicle control prior to administration of ioversol, and kidneys were imaged by multiphoton intravital microscopy. Scale bars: 100 μm. Inflammation was quantified by manual counting of stationary GFP+ leukocytes (saline vs. cilastatin, *P = 0.02, n = 3/group, 2-tailed Student’s t test). (F and G) WT C57BL/6 mice were treated with cilastatin or normal saline vehicle prior to ioversol administration. Urine output and serum creatinine as a measure of kidney function was determined on days 1 and 3 after contrast treatment (ref. values 0.04–0.08 mg/dl) (saline vs. cilastatin, creatinine day 3, **P = 0.003, n = 4/group, 2-tailed Student’s t test).

