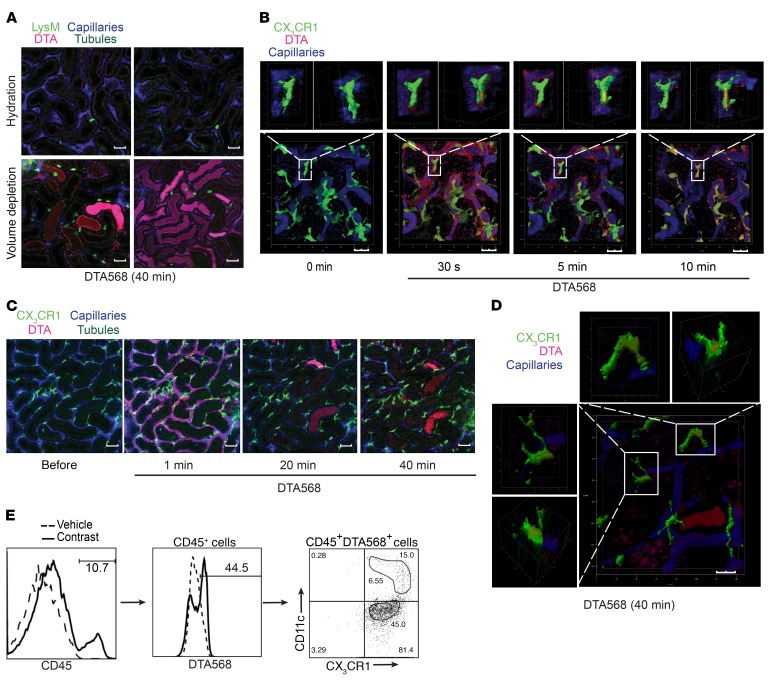
Figure 5. Contrast uptake and reabsorption in the kidney.
(A) LysM(gfp/gfp) mice were injected with CF568- labeled DTA (DTA568) and imaged with multiphoton intravital microscopy. Upper panels: hydrated mice (i.v. normal saline); lower panels: volume-depleted mice. Capillaries were labeled with Qtracker, and tubules are visualized by autofluorescence. Images are representative of 3 independent experiments. Scale bars: 100 μm. (B) Hydrated CX3CR1(gfp/+) mice were treated with CF568-labeled DTA and imaged with multiphoton intravital microscopy. 3D reconstruction (Z-stack) of DTA uptake in CX3CR1+ resident phagocytes over 10 minutes. Images are representative of 3 independent experiments. Scale bars: 20 μm. (C) Tubular uptake of DTA in volume-depleted CX3CR1(gfp/+) mice over 40 minutes by multiphoton intravital microscopy. Images are representative of 3 independent experiments. Scale bars: 100 μm. (D) 3D reconstruction (Z-stack) of DTA uptake in CX3CR1+ resident phagocytes in volume-depleted mice at 40 minutes. Images are representative of 3 independent experiments. Scale bar: 20 μm. (E) Mice were volume depleted and treated with CF568-labeled DTA for 1 hour, and contrast uptake was analyzed by flow cytometry in resident phagocytes (CD45+CX3CR1+DTA+ and CD45+CX3CR1+CD11c+DTA+). Images are representative of 3 independent experiments.

