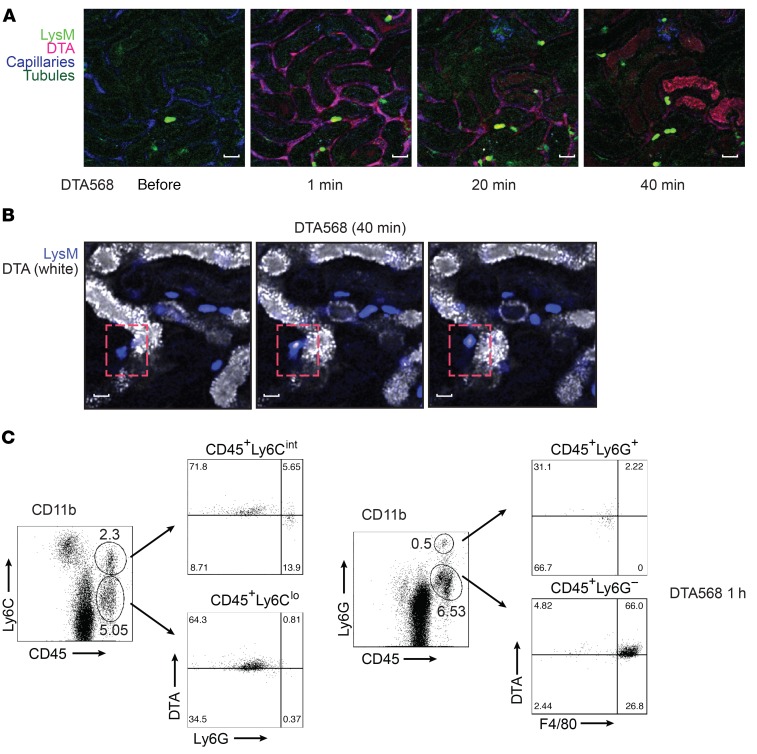
Figure 6. Contrast uptake by infiltrating LysM-GFP+ leukocytes.
(A) LysM(gfp/gfp) mice were injected with CF568-labeled DTA and imaged with multiphoton intravital microscopy. Capillaries were labeled with Qtracker, and tubules are visualized by autofluorescence. Images are representative of 3 independent experiments. Scale bars: 50 μm. (B) Infiltrating LysM-GFP+ leukocytes (blue) interacting directly with DTA-laden tubules (white) at 40 minutes (dashed red boxes). Images are representative of 3 independent experiments. Scale bars: 25 μm. (C) Flow cytometry characterization of contrast uptake in leukocytes isolated from mouse kidneys 1 hour after treatment with CF568-labeled DTA. Leukocytes were sorted using CD11b+, and CD45+, Ly6C+, Ly6G+, F4/80+ populations were analyzed for DTA uptake. Images are representative of 3 independent experiments.

