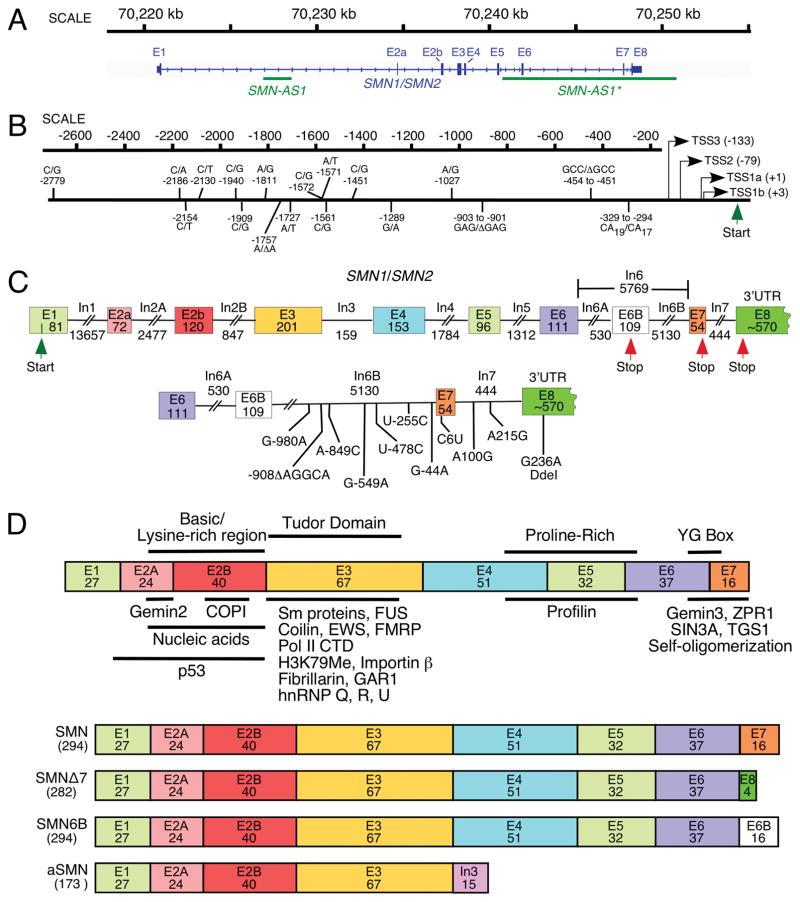
Fig. 1.
Organization of SMN gene. (A) A view of human SMN1/SMN2 gene(s) located on chromosome 5. Exons and introns are shown as boxes and lines, respectively. Loci of antisense RNAs, SMN-AS1 [27], and SMN-AS1* [28] are marked with bars. (B) Diagrammatic representation of human SMN promoter region. Multiple transcription start sites (TSS) identified so far are indicated using arrows. Numbers in brackets correspond to their position relative to TSS1a (+1). TSS1a and TSS2 were identified in [29] as transcription start sites preferentially used in adult and fetal tissues, respectively. TSS1b was mapped in Echaniz-Laguna et al. [30], and TSS3 was identified in Monani et al., [31]. Nucleotide differences between the SMN1 and SMN2 promoters are indicated based on Monani et al., [31]; [29, 32]), where nucleotide positions were calculated from TSS1a. Translation initiation site is marked as Start. (C) Diagrammatic representation of the SMN1/SMN2 pre-mRNA. Exons and introns are shown as boxes and lines, respectively. Sizes of exons and introns are indicated in nucleotides (nts). The translation initiation and termination sites are marked as Start and Stop, respectively. Exon 8 is mostly used as the 3′ untranslated region (UTR). The bottom panel indicates nucleotides differences between SMN1 and SMN2 in the region located downstream of exon 6B. The last position of intron 6B is designated as −1. For exons 7 and 8, as well as intron 7, counting starts with the first position of the respective exon or intron. (D). Diagrammatic representation of SMN protein isoforms. Protein regions encoded by each exon are shown as colored boxes with the number of amino acids given. In the top panel, protein domains are indicted above, while SMN interacting partners are shown below the diagrammatic representation of the full-length SMN. For further details see Singh et al. [13]. The bottom panel shows the known SMN isoforms as compared to the full-length SMN protein. These isoforms are generated either due to exon 7 skipping or exonization of a region within intron 6 [33] or intron 3 retention [34]. The size of each isoform (in amino acids) is given in brackets. Abbreviations are given in Table 2

