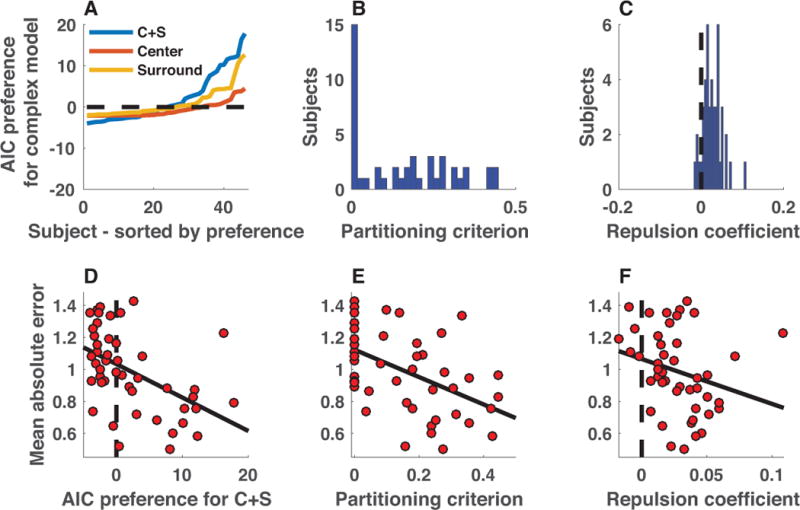
Figure 9. Heterogeneous chunking strategies across individual subjects provide empirical evidence for the performance advantages afforded by chunking.

A) AIC difference between simple mixture model and more complex center (orange), surround (yellow), and center + surround (blue) models is plotted for each subject, sorted by model preference (positive values indicate that more complex model is preferred). Aggregate AIC values favored the C+S model, yet there was substantial variability across subjects in marginal improvement afforded by the C+S model over the simpler mixture model, with AIC values providing moderate evidence for the mixture in some subjects, but strong evidence for the C+S model in other subjects. B) Partitioning criterions best fit to subject data also reflected heterogeneity in strategies across subjects, with a number of subjects best fit with criterion values near zero, and another subset of subjects taking values across a wider range from 0.1-0.5. C) Best-fitting repulsion coefficients tended to take positive values across subjects, indicating that independently represented colors tended to exert repulsive forces on one another by the best-fitting model parameterization. D-F) Subjects displaying more evidence of center-surround chunking performed better on the working memory task. D) Mean absolute error was greatest for the subjects that displayed the least evidence of center-surround chunking, as assessed by the difference in AIC between C+S and basic mixture models (ρ = −0.59, p = 1.6e-5). E&F) Errors were also elevated for subjects that were best fit with criterions near zero (E; ρ = −0.54, p = 8.5e-5) or with small or negative repulsion coefficients (F; ρ = −0.39, p = 7.4e-3).
