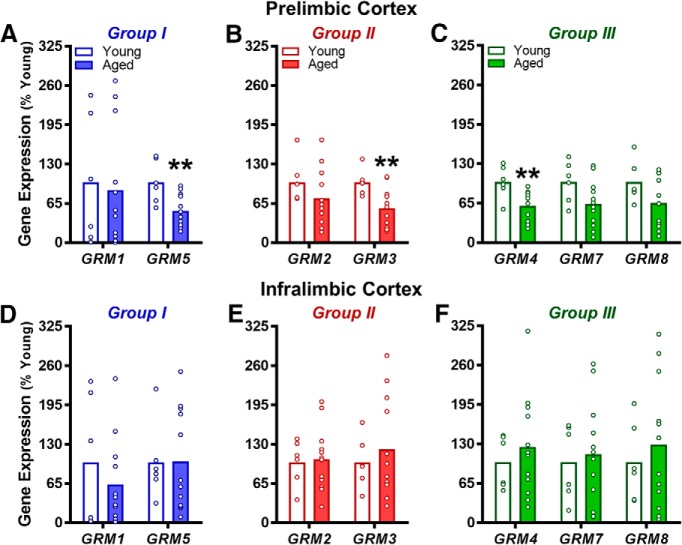
Figure 3.
mGluR gene transcript expression in the PrL and IL of young and aged rats. A, Group I mGluRs (in blue). Expression of GRM5, but not GRM1, was significantly lower in the PrL subregion of aged rats compared to young adults (**p < 0.01 vs young). B, Group II mGluRs (in red). Expression of GRM3, but not GRM2, was significantly lower in the PrL of aged rats compared to young adults (**p < 0.01 vs young). C, Group III mGluRs (in green). Expression of GRM4, but not GRM7 or GRM8, was significantly lower in the PrL of aged rats compared to young adults (**p < 0.01 vs young). D–F, Gene expression was not significantly different between young adult and aged rats in the IL subregion. In all panels, mean gene expression (transformed to “% of young” after normalizing raw Ct values to RPLP1; y-axis) is plotted as a function of gene (x-axis) and age group (separate bars; n = 6 young and n = 12 aged). Open circles represent values for individual rats and bars represent group means.

