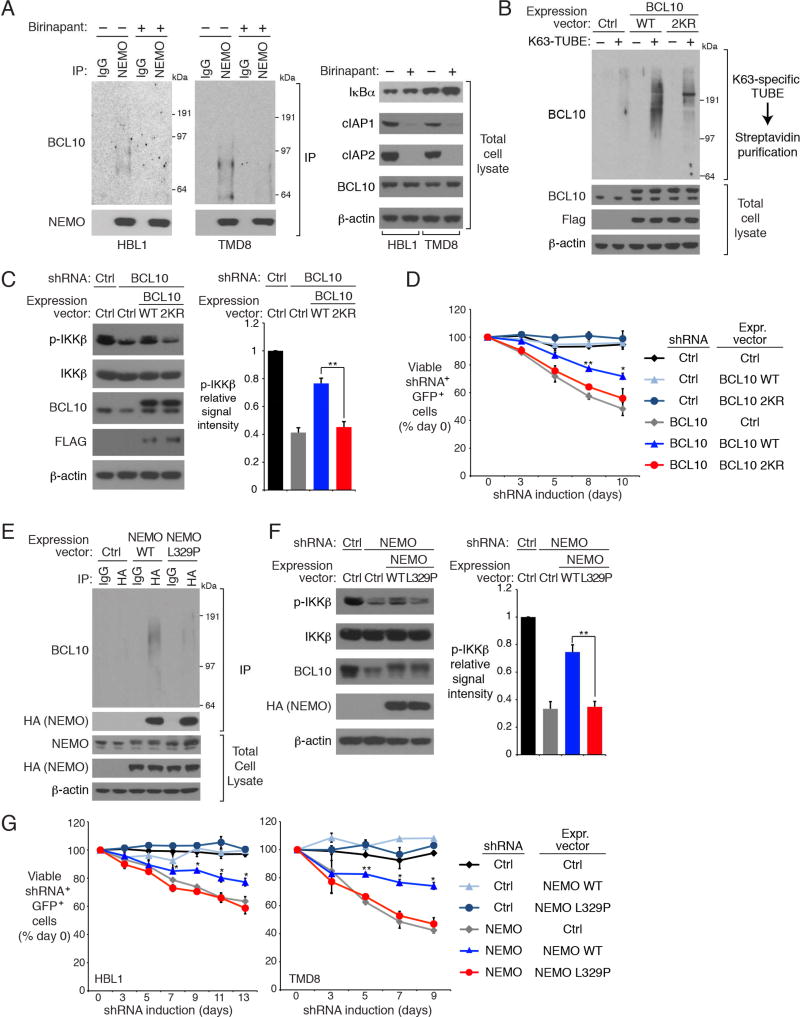
Figure 4. cIAP1/2 is required for BCL10 binding to IKK NEMO in ABC DLBCL.
(A) NEMO IPs or total lysates from HBL1 and TMD8 cells treated with birinapant (5 µM) for 24 hours were immunoblotted for the indicated proteins. (B) Cell lysates of HBL1 cells expressing WT or 2KR mutant BCL10 were subjected to biotin-labeled K63-specific TUBE binding and streptavidin purification, and analyzed by immunoblotting. (C) Control or BCL10 shRNAs were inducibly expressed in HBL1 cells that had been transduced with WT or 2KR BCL10, or with a control vector. Lysates were analyzed by immunoblotting for the indicated proteins. Relative phospho- (p-) IKKβ levels were quantified by densitometry (right). Error bars denote SEM. p values (Student’s t test) compare the BCL10 WT and 2KR rescue groups. (D) HBL1 cells transduced with WT or 2KR BCL10, or with a control vector, were induced to express control or BCL10 shRNAs along with GFP. The fraction of viable, GFP+/shRNA+ cells relative to the live cell fraction is plotted at the indicated times following shRNA induction, normalized to day 0 values. Error bars denote SEM. p values (Student’s t test) compare the BCL10 WT and 2KR rescue groups at the indicated time points. (E) Anti-HA IPs or total lysates of HBL1 cells expressing the indicated HA epitope-tagged WT or L329P mutant NEMO were analyzed by immunoblotting for the indicated proteins. (F) Control or NEMO shRNAs were inducibly expressed in HBL1 cells that had been transduced with WT or L329P NEMO, or with an empty vector. Lysates were analyzed by immunoblotting for the indicated proteins. Relative p-IKKβ levels were quantified by densitometry. Error bars denote SEM. p values (Student’s t test) compare the NEMO WT and L329P rescue groups. (G) Cells transduced with WT or L329P NEMO, or with a control vector, were induced to express control or NEMO shRNAs along with GFP. The fraction of viable, GFP+/shRNA+ cells relative to the live cell fraction is plotted at the indicated times following shRNA induction, normalized to day 0 values. Error bars denote SEM. p values (Student’s t test) compare the NEMO WT and L329P rescue groups at the indicated time points; * p <0.05; ** p < 0.01. See also Figure S4.

