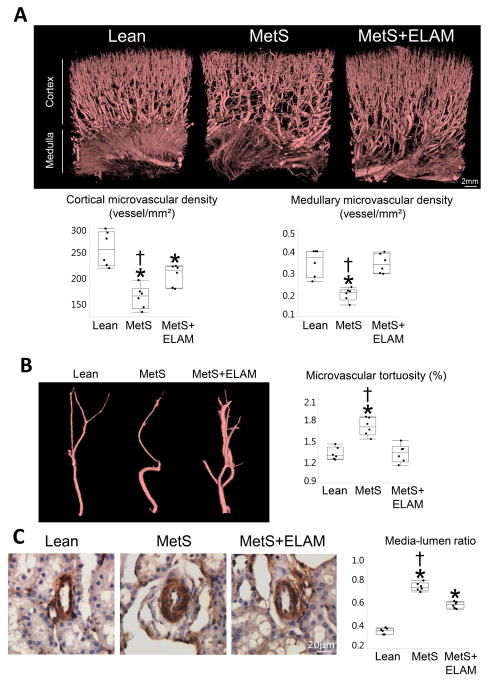
Figure 4. ELAM improved PTC and microvascular remodeling.
A: Representative 3-dimensional microcomputed-tomography images of the kidney and quantification of spatial density of cortical and medullary microvessels (n=6/group). B, Vessel tortuosity was higher in MetS, but normalized in ELAM-treated pigs (n=6/group). C: Renal vessel wall-to-lumen ratio in α-smooth muscle actin (SMA) stained slides. Vessel wall-to-lumen ratio, which was higher in MetS compared to Lean, improved in ELAM-treated pigs (n=6/group). *p<0.05 vs. Lean, †p<0.05 vs. MetS+ELAM.

