
Figure 4.
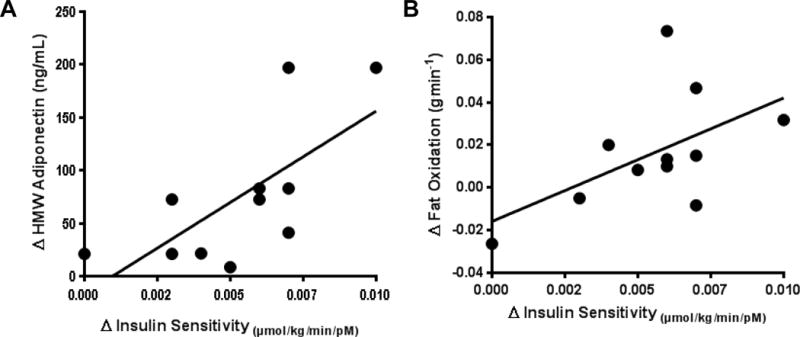
Correlation between pre- to post-intervention changes in ISIOGTT and A. plasma HMW adiponectin (rho = 0.70; P<0.05) and, B. whole body fat oxidation (rho = 0.86; P<0.05). Data were analysed using a Spearman’s rank correlation.
Official websites use .gov
A
.gov website belongs to an official
government organization in the United States.
Secure .gov websites use HTTPS
A lock (
) or https:// means you've safely
connected to the .gov website. Share sensitive
information only on official, secure websites.
Correlation between pre- to post-intervention changes in ISIOGTT and A. plasma HMW adiponectin (rho = 0.70; P<0.05) and, B. whole body fat oxidation (rho = 0.86; P<0.05). Data were analysed using a Spearman’s rank correlation.