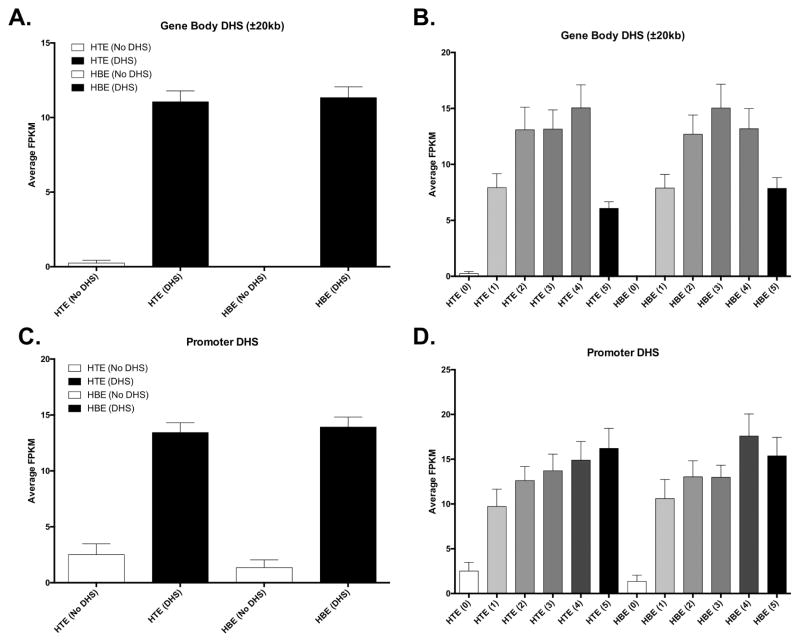
Figure 4. Gene expression is tightly associated with open chromatin.
All plots: Average gene expression (FPKM) in HTE and HBE cultures (x-axis) in the indicated groups. (A) Genes with and without DHS in the gene body or 20kb up/downstream. (B) Genes with (1–5) and without (0) DHS in the gene body or 20kb up/downstream, with DHS binned by quintile intensity (1–5). (C) Genes with and without DHS in the promoter (2 kb). (D) Genes with (1–5) and without (0) DHS in the promoter (2 kb), with DHS binned by quintile intensity (1–5).

