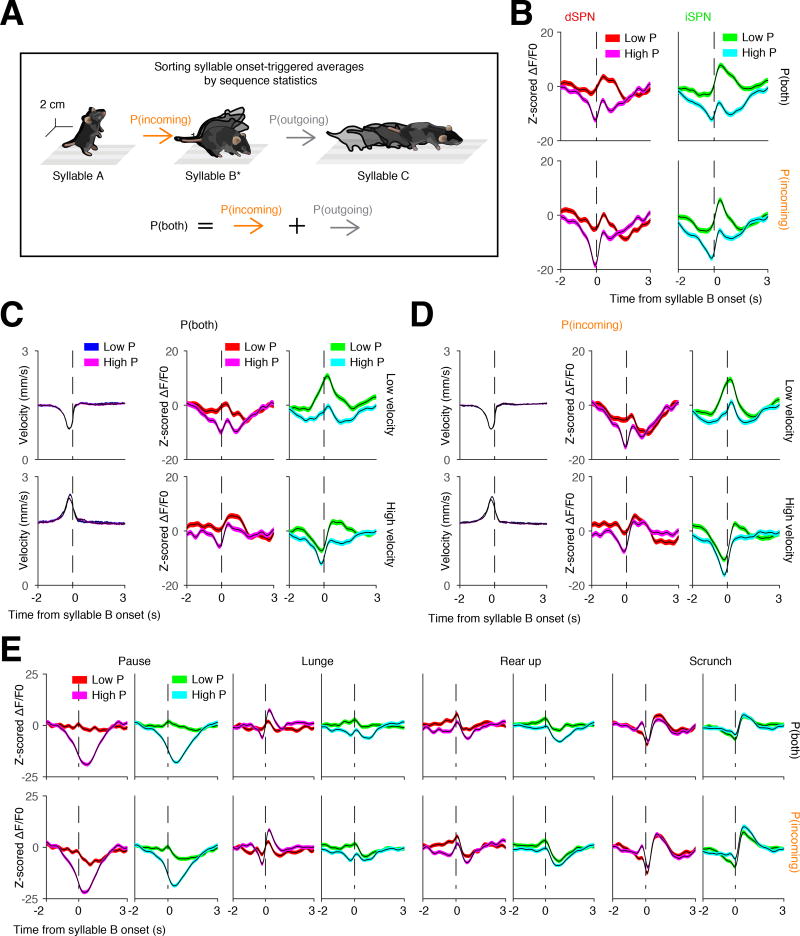
Figure 4. Sequence-dependent syllable representations in DLS.
A. Schematic of an example syllable sequence. Throughout all panels in this figure, waveforms are aligned to syllable B (starred) and then sorted based on the likelihood of either the incoming transition, or both the incoming and outgoing transitions.
B. Grand average photometry waveforms (red colors, dSPNs; green colors, iSPNs; n = 8 mice) for all syllables, separated by high or low probability of expression (here defined as above or below the 50th percentile probability, respectively). Top, waveforms sorted based upon the summed probability of incoming and outgoing syllables. Bottom, waveforms sorted based upon the probability of the incoming syllable.
C and D. Same as B but controlling for the 3D velocity of the incoming syllable (n = 8 mice). Velocities were grouped by whether they were above or below the 50th percentile of average velocity prior to syllable onset. Syllables were sorted by either high or low incoming velocity, and the associated neural waveforms were then sorted by either high or low probability of combined (C) or incoming (D) syllable expression.
E. Individual syllables analyzed using the same scheme shown in A.

