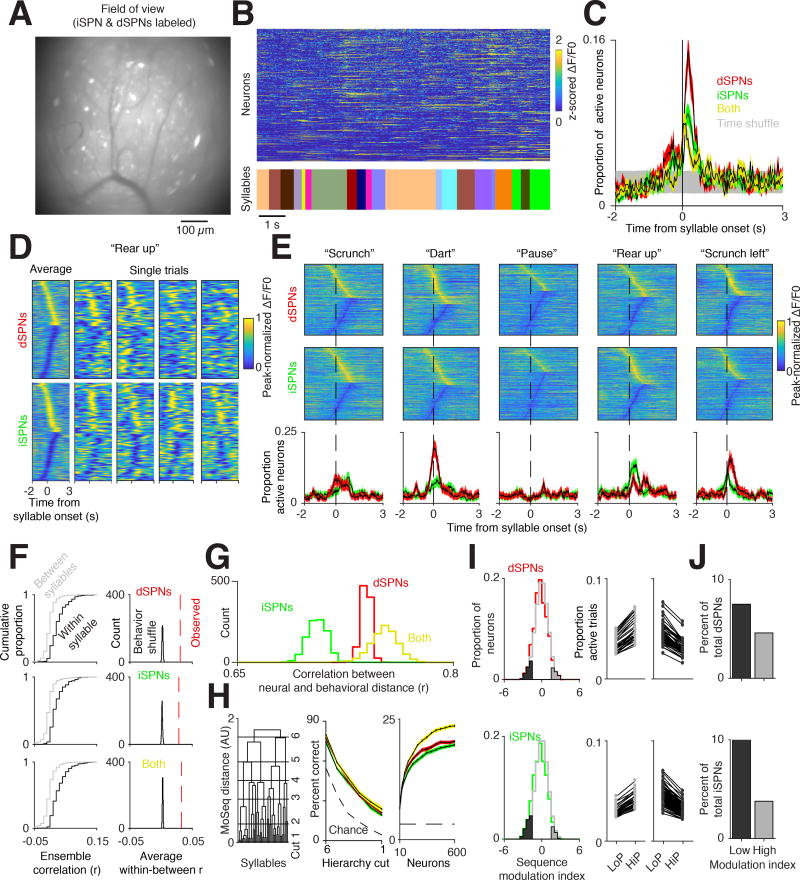
Figure 5. Direct and indirect pathway neural ensembles encode syllable identity.
A. Example miniscope field of view (FOV) from a mouse with both dSPNs and iSPNs labeled. Scale bar = 100 µm.
B. Normalized fluorescence of individual neurons extracted using CNMF-e (top, see Methods) aligned to behavioral syllables (bottom, each syllable uniquely color coded).
C. Proportion of active direct (red), indirect (green), and both pathway (yellow) neurons aligned to syllable onset (see Methods). Time-shuffled data is shown in gray (95% confidence interval). Shading indicates bootstrap SEM.
D. Left columns, peak-normalized fluorescence averaged across all instances of the same syllable, in this case a “rear up.” All neurons from all mice are included in this representation. Cells with positive peaks were sorted from earliest to latest, then cells with negative-going peaks were sorted from latest to earliest. Single trials (all other columns) are shown for all neurons, merged across mice (see Methods). In each panel here (and in E) cellular traces are normalized individually to emphasize responses.
E. Top, peak-normalized fluorescence traces for five different syllables aligned to syllable onset, with human annotations above. Cells are sorted as in D. Bottom, proportion of dSPNs (red) and iSPNs (green) active aligned to syllable onset (defined as exceeding two SDs above the mean ΔF/F0). Shading indicates 95% bootstrap confidence interval.
F. Left, cumulative distribution function of ensemble correlations, computed using different examples of the same syllable (black) or examples of different syllables (gray) for the direct pathway (top), indirect pathway (middle), or both (bottom). Right, histogram of the average within syllable correlation after shuffling syllable identities.
G. Histogram of correlations between neural activity distance and Moseq-defined behavioral distance for dSPNs (red), iSPNs (green), or both cell types (yellow).
H. Left, Decoding accuracy along different cuts of the behavioral hierarchy for dSPNs (red), iSPNs (green), and both cell types (yellow) (as in Figure 3F, syllables are clustered into larger groups moving from cut 1 to cut 6). Right, decoding accuracy for individual syllables as a function of the number of neurons provided to the decoder. Shading indicates 99% bootstrap confidence interval. Chance performance increased at higher hierarchical cuts given fewer classes to decode.
I, Left, Distribution of single neuron modulation with respect to syllable sequence frequency. Lower indices indicate higher activity for low probability transitions, while higher indices indicate higher activity for high probability transitions (see Methods). Cells significantly modulated relative to a shuffle control (gray line) are highlighted in dark and light gray. Middle, Each pair of dots indicates the proportion of trials a given neuron was active across all syllables for high (HiP) and low (LoP) transition probabilities. Shown are neurons that increase activity for high transition probability examples (left, light gray) and low transition probability examples (middle, dark gray) from Left.
J. Percent of cells that have a significant modulation index (p<.05 relative to shuffle controls) reveals a greater number of inhibited than activated neurons during high probability sequences.

