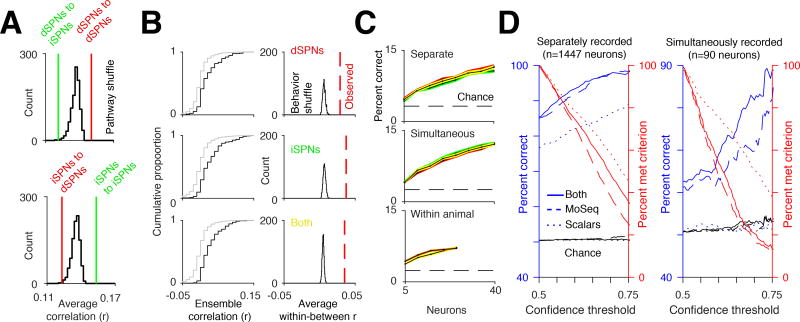
Figure 6. Simultaneous imaging of dSPNs and iSPNs reveals pathway decorrelations.
A. Average cross-correlations compared to the average cross-correlation of cell-type-identity-shuffled traces when the animal’s 3D velocity exceeded the 50th percentile. For all comparisons between the observed correlations and identity-shuffled traces, p<.01.
B. Left, similar to Figure 5F, cumulative distribution function of ensemble correlations for separate examples of the same syllable (black, within syllable) and examples of different syllables (gray, between syllable). Right, histogram of average within syllable correlation after shuffling syllable identities. Red line shows the observed average correlation before shuffling.
C. Top, decoding accuracy of all syllables in psuedopopulations of separately recorded iSPNs (green) and dSPNs (red) as a function of neuron number. Decoding performance using both iSPNs and dSPNs shown in yellow. Middle, decoding accuracy using psudopopulations of simultaneously recorded iSPNs and dSPNs (see Methods). Bottom, example decoding accuracy using simultaneously recorded iSPNs and dSPNs from the same mouse (orange), and from a pseudopopulation of iSPNs and dSPNs where both the iSPNs and the dSPNs used were from a single animal (yellow).
D. Left, performance of a classifier predicting pathway identity of separately recorded dSPNs and iSPNs (see Methods) using MoSeq (blue dashed line), scalars (blue dotted line), or both combined (blue solid line), as a function of the confidence criterion for the classifier (percent of neurons meeting criterion shown in red, see Methods). Right, same as left, except predicting the class of simultaneously recorded dSPNs and iSPNs. Note that the noise in percent correct is due to finite size effects (i.e. there are fewer neurons to classify in the test set).

