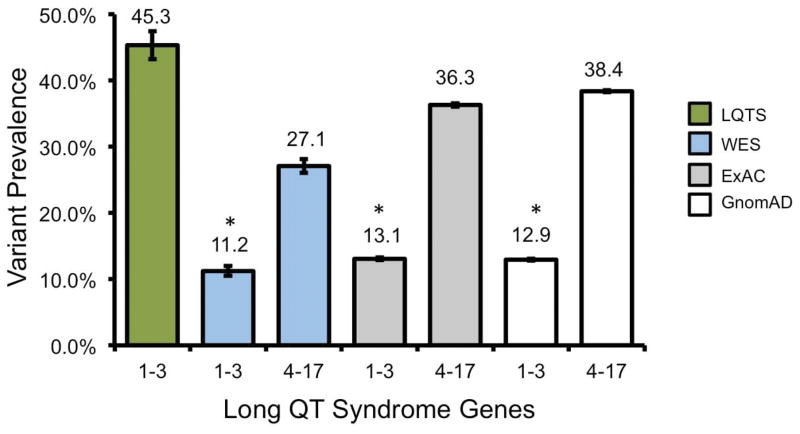
Figure 2.
Variant prevalence for LQTS, WES, and control cohorts. Bar graph of the frequency of LQTS-associated gene variants among individuals with LQTS (green fill), WES (light blue fill) and ostensible healthy control individuals (ExAC, light gray and GnomAD, dark gray fill). Error bars denote 95% CI. *, P<0.0001

