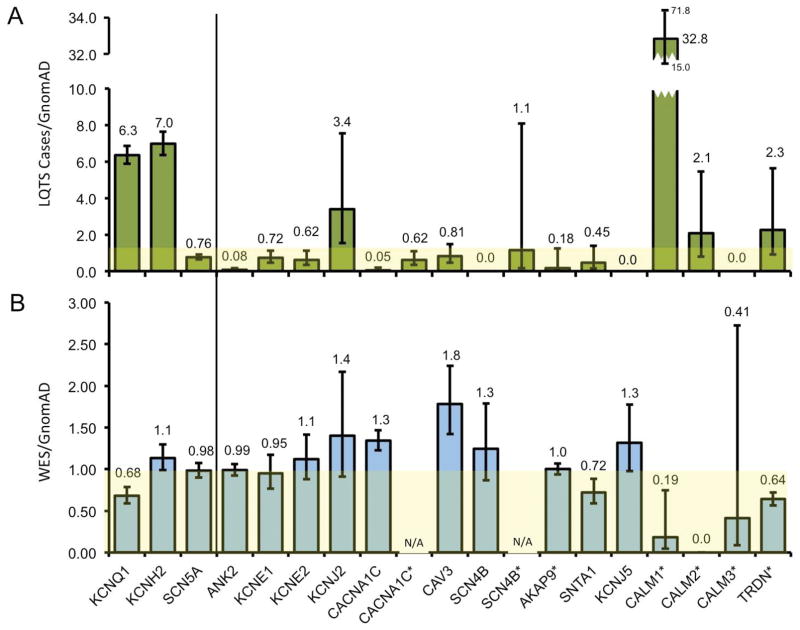
Figure 4.
Gene-specific signal-to-noise frequencies. A, Bar graph of the frequency of LQTS/GnomAD-associated gene variants in the LQTS case cohort (green fill). B, Bar graph of the frequency of WES cohort/GnomAD-associated gene variants (blue fill). Yellow background denotes signal-to-noise threshold of 1. * Indicates a phenotype-positive genotype-negative proband sample. Error bars denote 95% CI.

