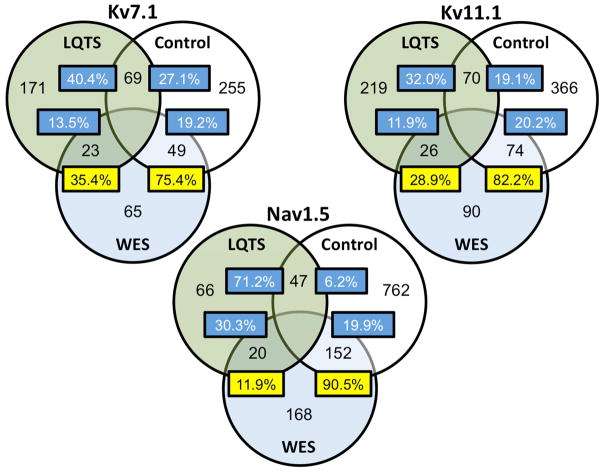
Figure 5.
Variant position overlap between LQTS, WES, and control cohorts. Venn diagram of the co-localization of variants to residues shared between the LQTS (green fill), control (white fill), and WES (blue fill) cohorts. The numbers within the circles demonstrate number of unique amino acid residues that host variants/mutations within each cohort. Numbers within overlapping portions of the circles reflect the number of residues with variants shared between respective cohorts. The proportion of shared variants, out of the cohort total, is noted within each box.

