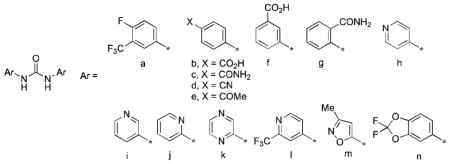
Table 1.
Physicochemical and in vitro ADME properties for N,N′-diarylureas 1–20.

| |||||
|---|---|---|---|---|---|
| Compd | Ar | LogD7.4 a | PSA (Å2)b | Sol2.0/Sol6.5 (μg/mL)c | h/m CLint (μL/min/mg protein)d |
| 1 | a,a | 4.5 | 41.1 | <1.6/<1.6 | 10/7 |
| 2 | l,l | 3.0 | 66.9 | 12.5–25/12.5–25 | <7/<7 |
| 3 | h,h | 1.3 | 66.9 | >100/12.5–25 | <7/188 |
| 4 | k,k | 0.8 | 92.7 | 6.3–12.5/6.3–12.5 | 18/157 |
| 5 | n,n | 4.4 | 78.1 | <1.6/<1.6 | <7/12 |
| 6 | a,h | 3.2 | 54.0 | 6.3–12.5/6.3–12.5 | 12/37 |
| 7 | a,i | 3.0 | 54.0 | 50–100/12.5–25 | 13/154 |
| 8 | a,j | 3.7 | 54.0 | 1.6–3.1/<1.6 | 188/705 |
| 9 | a,k | 3.0 | 66.9 | 1.6–3.1/<1.6 | 210/160 |
| 10 | a,m | 3.2 | 67.2 | 12.5–25/6.3–12.5 | 73/108 |
| 11 | a,b | 1.5 | 81.3 | <1.6/12.5–25 | <7/<7 |
| 12 | a,f | 1.6 | 81.3 | 1.6–3.1/12.5–25 | <7/<7 |
| 13 | a,c | 2.7 | 84.2 | 6.3–12.5/6.3–12.5 | 28/22 |
| 14 | a,g | 3.3 | 84.2 | 1.6–3.1/1.6–3.1 | 81/69 |
| 15 | a,d | 3.8 | 64.9 | <1.6/<1.6 | <7/12 |
| 16 | a,e | 3.6 | 58.2 | <1.6/<1.6 | 16/14 |
| 17 | a,n | 4.5 | 59.6 | <1.6/<1.6 | <7/<7 |
| 18 | a,l | 3.8 | 54.0 | 3.1–6.3/3.1–6.3 | <7/<7 |
| 19 | d,l | 3.0 | 77.8 | 1.6–3.1/1.6–3.1 | <7/<7 |
| 20 | l,n | 3.7 | 72.5 | 3.1–6.3/3.1–6.3 | <7/16 |
LogD values were estimated by correlation of their chromatographic retention properties using a modified gradient HPLC method adapted from Lombardo et al.27
calculated using ChemAxon JChem for Excel
Compounds in DMSO were spiked into either pH 6.5 phosphate buffer or 0.01 M HCl (approx. pH 2.0) and analyzed by nephelometry28 to determine a concentration range.
in vitro intrinsic clearance measured in human and mouse liver microsomes
