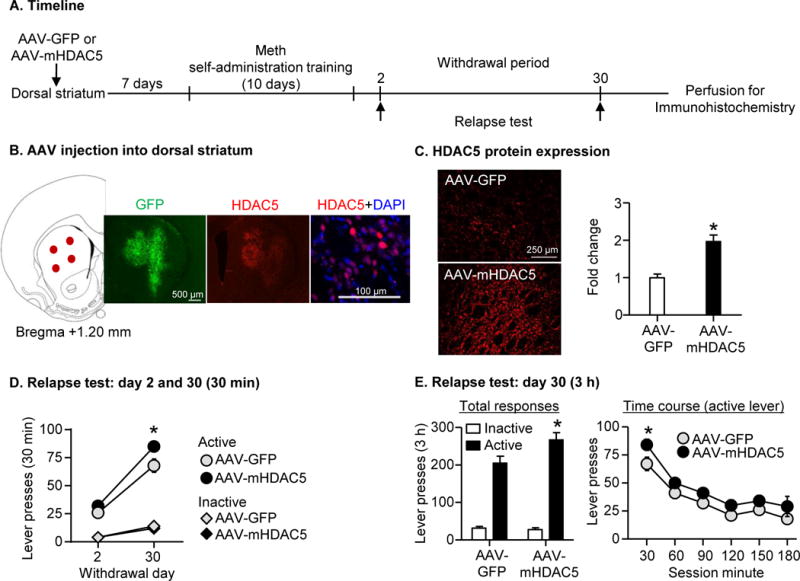
Figure 2. Overexpressing nuclear HDAC5 in dorsal striatum (DS) potentiated incubation of Meth craving.

(A) Timeline of the experiment. (B) Left: representative anatomical locations of AAV injections (red dots) into DS [mm from Bregma (97)]; Right: representative images of GFP immunostaining from AAV-GFP group, HDAC5 immunostaining from AAV-mHDAC5 group, and HDAC5 (red) +DAPI (blue) double staining from AAV-mHDAC5 group (C) Left: representative images of HDAC5 immunostaining from DS of AAV-GFP and AAV-mHDAC5 groups; Right: relative HDAC5 fluorescent intensity in DS. Data are presented as fold change of mean values in the AAV-GFP group. * p<0.001; n=10-13 per group. Error bars indicate SEM. (D) Relapse test on withdrawal days 2 and 30: Data are mean±SEM of responses on the previously active lever and on the inactive lever during the 30-min relapse test on withdrawal day 2 and the first 30 min of the 3-h relapse test on withdrawal day 30. * Different from day 2, p<0.05, n=10-13 per group. (E) Relapse test on withdrawal day 30: Data are mean±SEM of responses on the previously active lever and on the inactive lever during the 3-h relapse test. During testing, lever-presses led to contingent presentations of the tone-light cue previously paired with Meth infusions during training, but not Meth. * Different from AAV-GFP, p<0.01, n=10-13 per group.
