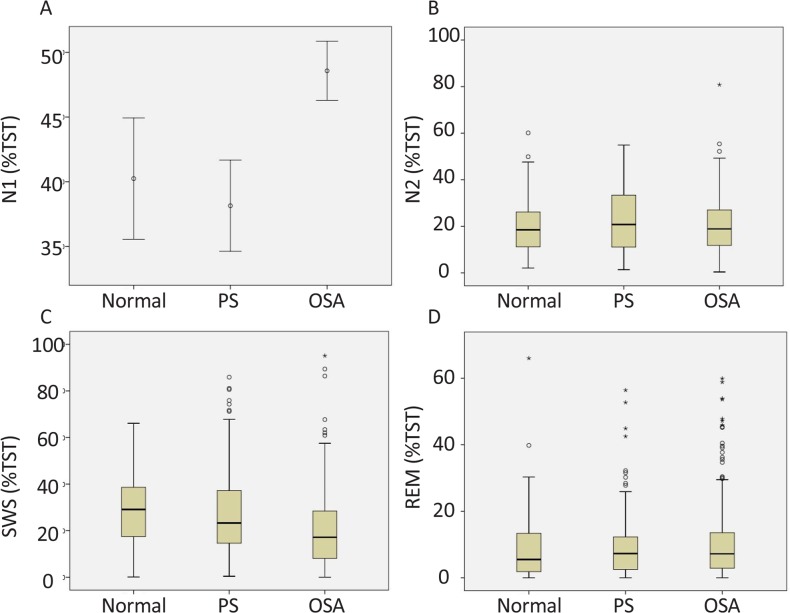
Figure 2.
The effect of PS and OSA on sleep architecture (sleep stages)
N1 stage showed a significant increase induced by OSA (A) and SWS showed a significant decline induced by OSA (C). N2 (B) and REM (D) stages did not show any difference among the groups. The data of N1 was normally distributed and analyzed using One-way ANOVA test followed by Tukey’s test; but, the data of N2, SWS, and, REM stages were non-normally distributed and analyzed using Kruskal-Wallis test followed by Dunn’s multiple comparisons test.
TST: Total Sleep Time; N1, stage 1 of non-REM sleep; N2, stage 2 of non-REM sleep; SWS: Slow-Wave Sleep; REM: Rapid Eye Movement.

