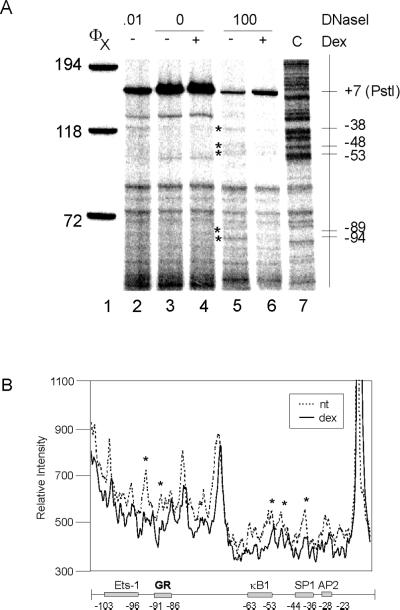
Figure 6.
DNaseI footprinting of the IκBα promoter (−100 to + 7). (A) Nuclei (lanes 3–6) or genomic DNA (lane 2) from A1-2 cells was digested with 0 (lanes 3 and 4), 0.01 (lane 2), or 100 units/ml (lanes 5 and 6) DNaseI, and the purified DNA was recut with PstI. DNA fragments were analyzed by reiterative primer extension. Lane 7: C sequencing track with the (−623/+11) IκBα-luc plasmid. (B) A line graph comparing lanes 5 and 6 band intensity with locations of transcription factor binding sites indicated.

