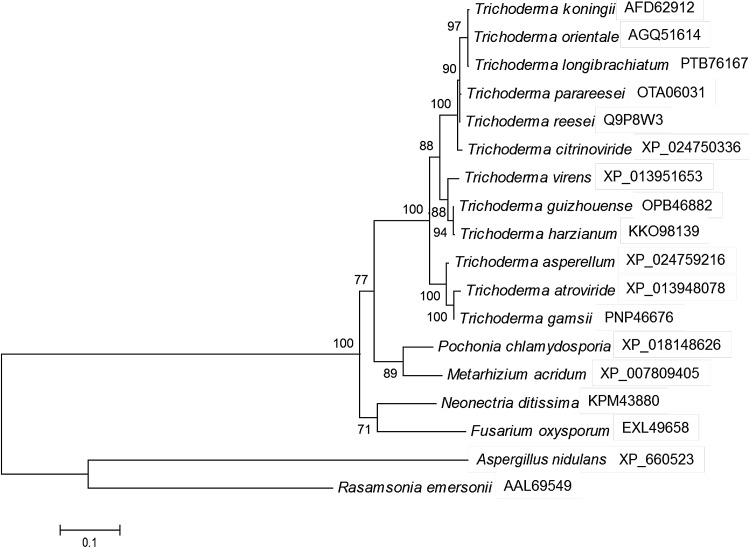
Fig. 1.
Phylogeny analysis of ACE1 in T. atroviride and other strains. NCBI accession numbers of ACE1 in each strain were signed after strain name. It was the maximum-likelihood trees of ACE1 amino acid sequences in NCBI database after aligned by Clustal X. The number signed in branch represented the bootstrap value after 100 replications

