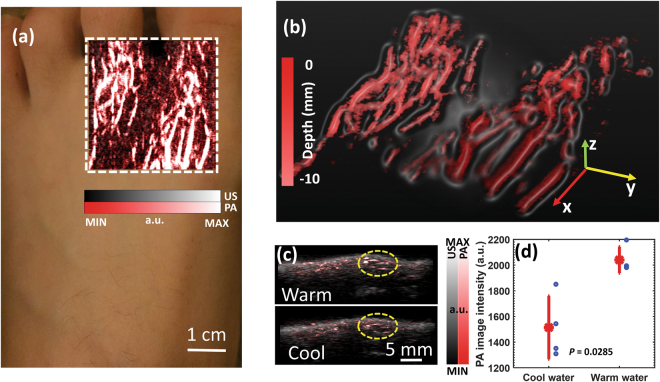
Figure 3.
(a) MIP PA and US combined image showing the vasculature in the dorsal surface of a human foot. The dashed rectangle indicates the imaged area. (b) Perspective view image showing the 3D vasculature. The depth (i.e., the position along the z axis) is color encoded. (c) B-scan PA and US combined images of the vasculature in foot surface acquired at a temperature of 40.8 and 34.2 degree Celsius. The dashed circles indicate the regions of interest (ROI) for quantifying the change of PA image intensity in response to the local cold exposure. (d) Data distribution showing the averaged PA image intensities of vessels within the ROI at the two different temperatures (i.e., 40.8 vs. 34.2 degrees Celsius). For the PA measurements at each temperature, the asterisk on red line shows the mean, and the distance above or below it shows the standard deviation. A p-value of 0.0285 was achieved for a two-tailed t-test (n = 4), demonstrating the capability of PA imaging in detecting the change in peripheral microvascular flow in response to the local cold exposure.

