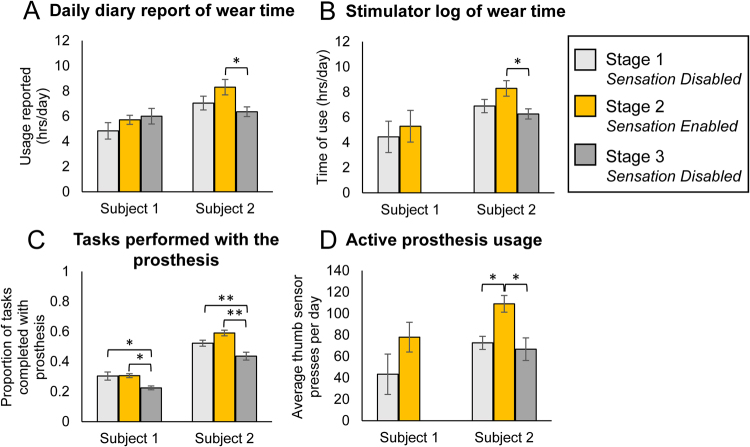
Figure 2.
Impact of sensation at home on prosthesis usage. (A) Daily diary reports of system wear time (S1: n = 6, 7, 7 for stages 1, 2, 3, respectively; S2: n = 11, 13, 14 for stages 1, 2, 3, respectively). (B) Stimulator log of system wear time (S1: n = 5, 4 for stages 1, 2, respectively; S2: n = 12, 13, 15 for stages 1, 2, 3, respectively). (C) Tasks performed with the prosthesis each day out of standard task list based on the UEFS (S1: n = 6, 7, 7 for stages 1, 2, 3, respectively; S2: n = 11, 13, 14 for stages 1, 2, 3, respectively). (D) Active usage of the prosthesis for grasp-related activities that involved triggering the pressure sensors. Raw sensor data was analyzed for peaks in force, which indicated instances that the prosthesis was used to manipulate or grasp objects (S1: n = 5, 4 for stages 1, 2, respectively; S2: n = 9, 13, 15 for stage 1, 2, 3, respectively). All subpanels: Error bars indicate standard error of the mean. Single asterisk indicates significance of p < 0.05. Double asterisks indicate significance of p ≤ 0.001.

