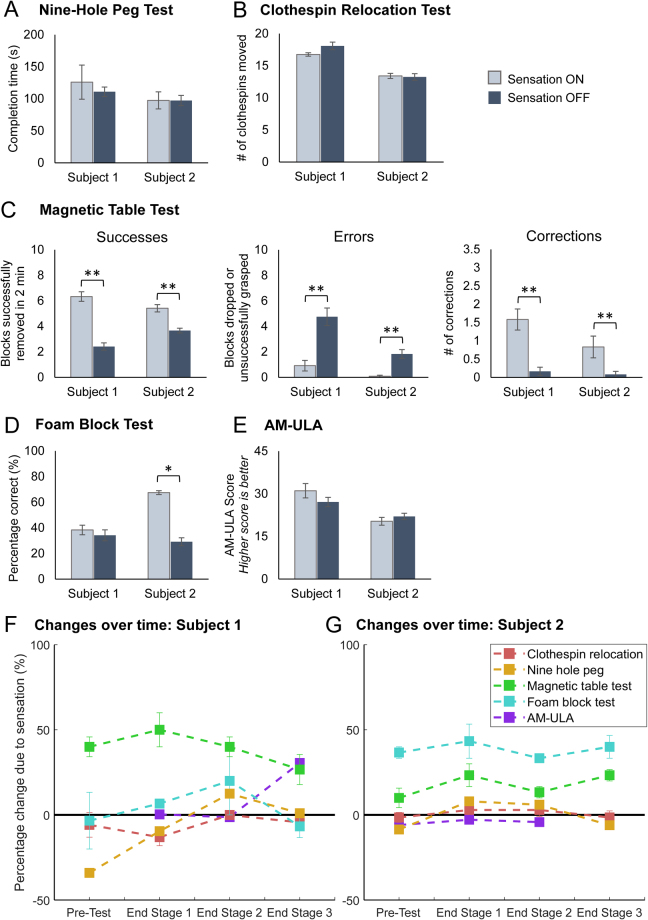
Figure 3.
Impact of sensation on functional performance within sessions (A–E) and over time (F,G). (A) Impact of sensation on the nine hole peg test. Faster completion times indicate better performance (n = 4 for each condition (sensation on/off)). (B) Impact of sensation on the clothespin relocation task. More clothespins moved indicates better performance (n = 12 for each condition). (C) Impact of sensation on the magnetic table test. Greater numbers of blocks removed in the allotted time (2 min) indicates better performance. Fewer grasping errors and more corrections also indicate better performance (all metrics: n = 12 for each condition). (D) Impact of sensation on the foam block identification test. Greater percentages of blocks identified correctly indicate better performance (n = 8 for each condition). (E) Impact of sensation on the AM-ULA. Higher scores indicate better performance (The AM-ULA was only scored for 3 of 4 testing sessions for each subject (see Methods); n = 3 for each condition). Panels A–E: Two sample t tests were used to compare performance with and without sensation. Single asterisk indicates significance of p ≤ 0.05. Double asterisks indicate significance of p ≤ 0.001. (F) Changes in sensation-enabled functional performance over time for Subject 1 and (G) Subject 2. Data is pooled within sessions (n = 3 for each testing session for the clothespin relocation test and magnetic table test; n = 2 for the foam block test; n = 1 for the nine hole peg test and AM-ULA). For F,G, percentage change due to sensation was calculated as the difference between performance with sensation on and off, normalized by the maximum possible score on the metric (magnetic table test: maximum of 10 blocks; foam block test: maximum of 100% accuracy; AM-ULA: maximum score of 40). The nine hole peg and clothespin relocation test scores were normalized to the maximum score reported across all testing sessions and subjects (see Methods). Points above the black line at zero indicate that performance was better with sensation than without. Points below the black line indicate that performance was worse with sensation than without. All panels: Error bars indicate the standard error of the mean.

