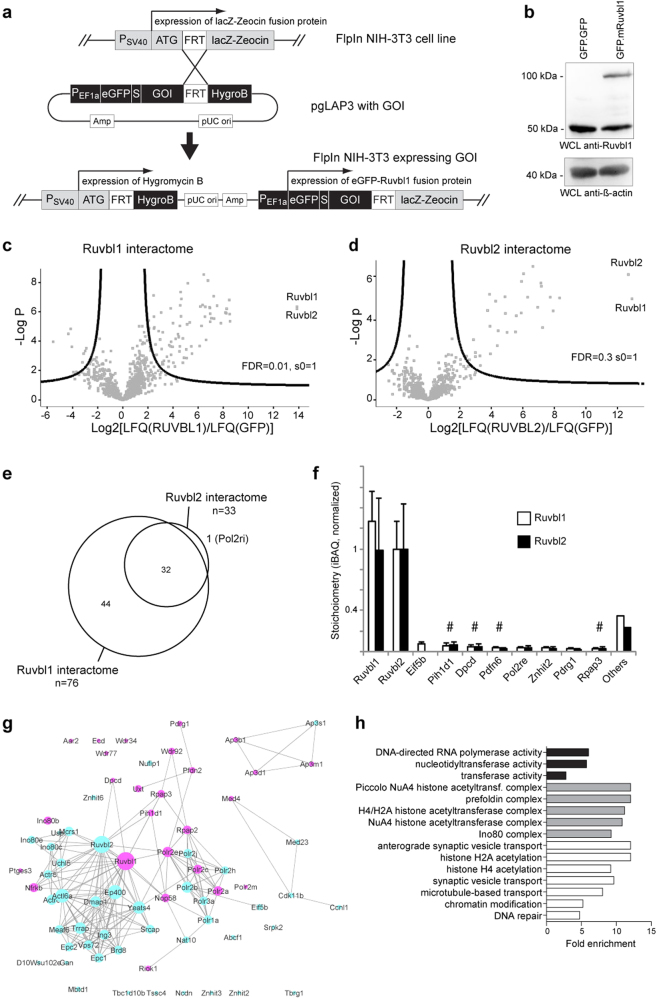
Fig. 4. A label-free quantitative proteomics screen identifies multiple ciliary proteins in the mammalian Ruvbl1 interactome.
a Cloning strategy to generate an FlpIn NIH-3T3 cell line stably expressing a GFP.Ruvbl1 transgene. b The GFP.Ruvbl1 transgene showed nearly endogenous Ruvbl1 protein expression levels in stably integrated FlpIn NIH-3T3 cells compared with cells expressing a GFP.GFP transgene. c, d Analysis of the Ruvbl interactome (n = 5). GFP.Ruvbl1 or GFP.Ruvbl2 were immunoprecipitated and analyzed by label-free quantitative proteomics. Seventy-six proteins had a significantly increased abundance in the GFP.Ruvbl1 immunoprecipitation (Ruvbl1) compared with the control (GFP) pulldown (c). Thirty-three proteins had a significantly increased abundance in the GFP.Ruvbl2 immunoprecipitation (Ruvbl2) compared with the control (GFP) pulldown (d). In the volcano plots, the significance between groups (−log10 p value) is plotted against the log2 fold change between groups. Dots outside the curved line represent proteins with significantly increased abundance (FDR 0.01, s0 = 1). The corresponding data for the Ruvbl1/2 interactome can be found in Suppl. Tables S1 and S2. e Comparison of the Ruvbl1 and Ruvbl2 interactome. The Ruvbl2 interactome overlapped with proteins identified as Ruvbl1 interactors. f Stoichiometry analysis of Ruvbl1 and Ruvbl2 interactors. iBAQ values were normalized to Ruvbl2 to obtain an estimation of the absolute abundances of proteins within the purified complex. The ten most abundant proteins in the Ruvbl1 interactome are depicted. # marks proteins previously associated with cilia. g STRING network visualization of the Ruvbl1 interactome demonstrated a prominent representation of ciliary proteins (violet = identified in Centrosome and Cilium Database (CCDB), blue = not identified in CCDB). h Gene ontology (GO) term overrepresentation analysis of Ruvbl1 interactors compared with non-enriched proteins (“background binding proteins”). Fold enrichment of the significantly enriched GO terms is plotted for GO-MF (molecular function, black bars), GO-CC (cellular compartment, gray bars), and GO-BP (biological process, white bars) terms. Statistical enrichment was performed using a Fisher’s exact test (FDR < 0.02)

