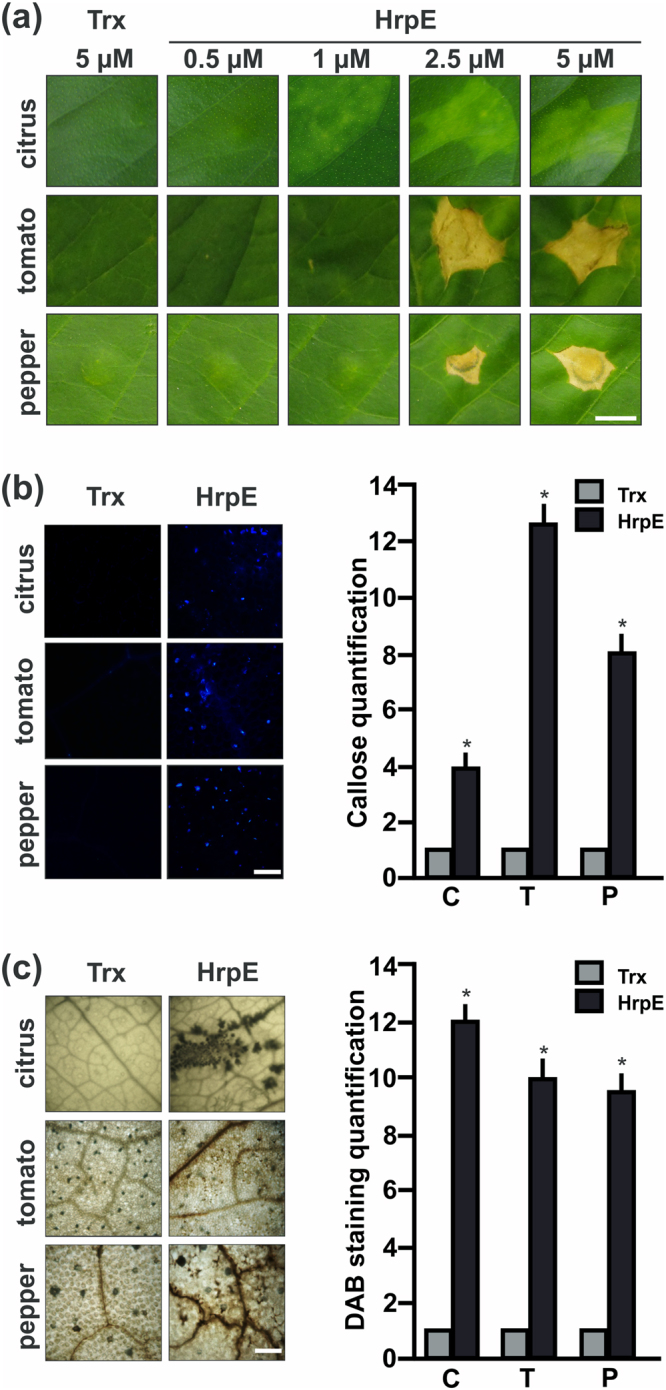
Figure 1.

Analysis of citrus, tomato and pepper leaves responses to Xcc HrpE. (a) Representative photographs of leaves responses to the infiltration of pure HrpE-Trx-6His (HrpE), ranging from 0.5 µM to 5 µM, and 5 µM Trx-6His (Trx) (control) 1 dpi. Bar indicates 0.5 cm. (b) Representative fluorescence microscopy photographs of aniline blue staining of callose deposition in leaves infiltrated with 2.5 µM HrpE and Trx (control) 8 hpi (tomato and pepper) and 16 hpi (citrus). Bar indicates 20 μm. The right panel shows the quantification of callose intensities in citrus (C), tomato (T) and pepper (P) tissues infiltrated with HrpE (black bars) relative to Trx (grey bars). (c) Representative photographs of DAB stained leaves infiltrated as in (b) (Bar indicates 1 mm). In citrus, H2O2 production is observed as brown precipitates in leaf tissues and in tomato and pepper, the brown precipitates are observed near to the leaf veins. The right panel shows the quantification of DAB staining in infiltrated C, T and P tissues with HrpE (black bars) relative to Trx (grey bars). For both, callose and DAB intensities quantifications, the means were calculated from 25 photographs obtained from different treated leaves from three independent experiments. Error bars indicate standard deviations. Asterisks represent significant differences based on one-way ANOVA (p < 0.05).
