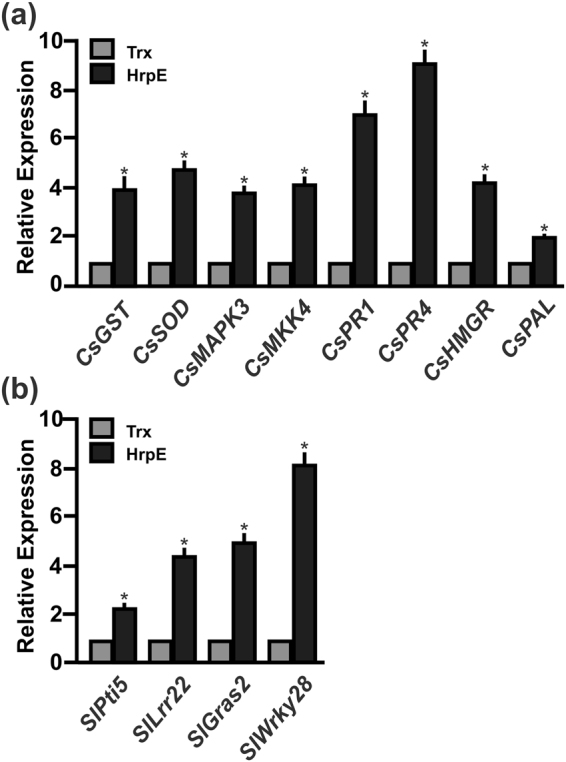
Figure 2.

Analysis of the expression levels of citrus and tomato defense response-related genes in leaves infiltrated with HrpE by qRT-PCR. (a) Expression levels of defense response-related genes in citrus leaves, 16 hpi, or (b) in tomato leaves, 4 hpi, with 2.5 µM HrpE. Black bars indicate the expression levels of the genes relative to the expression levels of 2.5 µM Trx infiltrated controls (grey bars). Values are the means of four biological replicates with three technical replicates each. Error bars indicate standard deviations. Results were analyzed by one-way ANOVA (p < 0.05). Asterisks represent significant differences based on one-way ANOVA (p < 0.05).
