Figure 3.
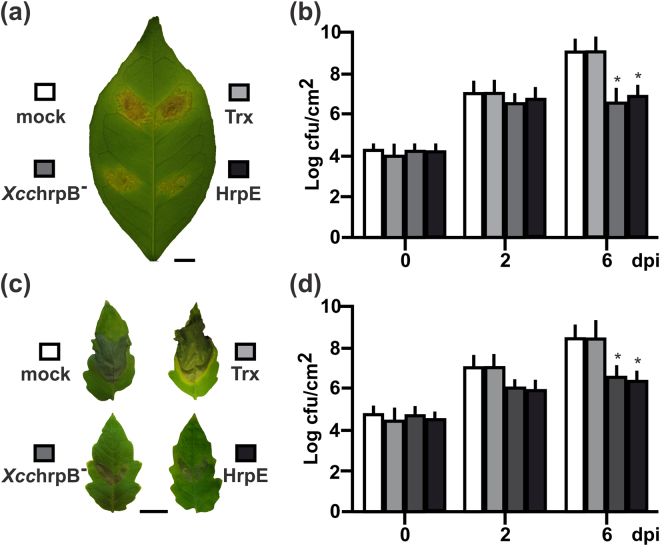
Analysis of bacterial infections in plants pre-infiltrated with HrpE. (a) Representative photographs of Xcc infected citrus and (c) Xcv infected tomato leaves that were pre-treated with 1 µM HrpE and XcchrpB− (107 cfu/mL); 1 µM Trx and mock (15 mM NaCl) were used as controls (Bar indicates 1 cm). (b,d) Quantification of bacterial growth in the leaves described above (a and c, respectively) at 0, 2 and 6 dpi. Values are the means obtained from 10 infiltrated leaves of each plant at different dpi. Error bars show the standard deviation. Asterisks indicate significant differences based on one-way ANOVA (p < 0.05).

