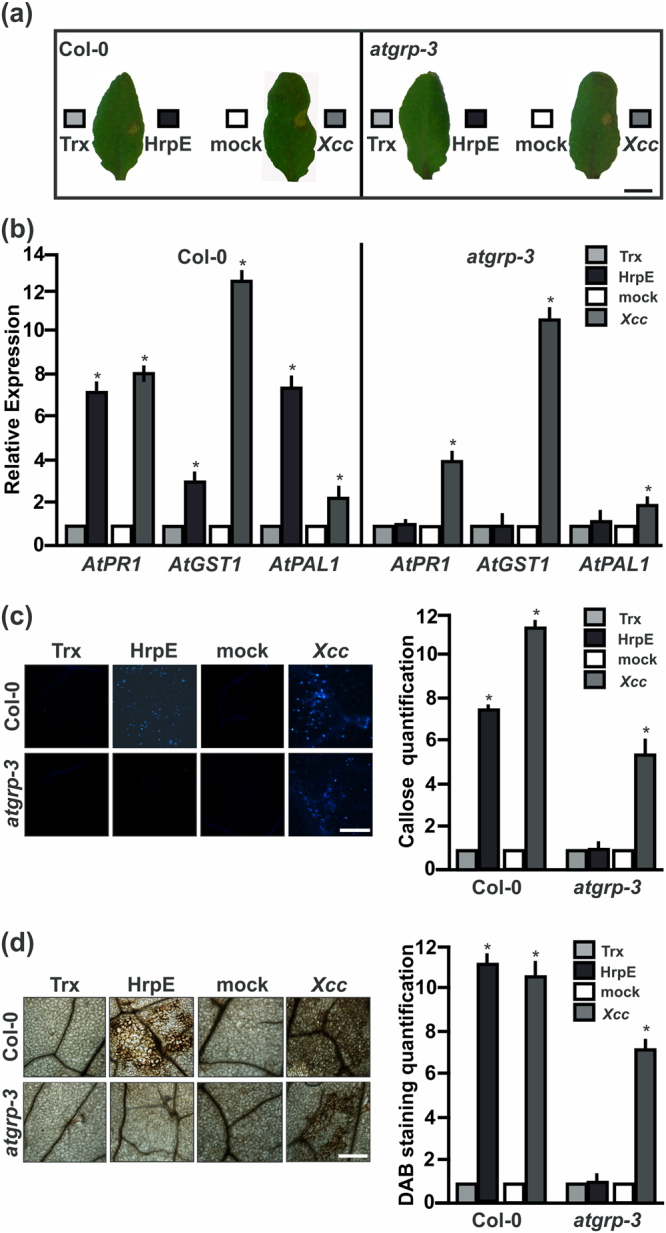
Figure 6.

AtGRP-3 is involved in plant defense responses elicited by HrpE. (a) Representative photographs of leaf responses in A. thaliana Col-0 and atgrp-3 to the infiltration of pure 2.5 µM HrpE or Trx (control) and Xcc (107 cfu/mL) or 15 mM NaCl as control (mock) 1 dpi. Bar represents 1 cm. (b) Analysis qRT-PCR of the expression levels of genes related with defense responses in Arabidopsis leaves, infiltrated as in (a). RNA was extracted from leaves 4 hpi. Darker bars indicate the expression levels of the genes after HrpE or Xcc infiltration relative to the expression levels of the Trx or NaCl controls (lighter bars), respectively. Values are the means of four biological replicates with three technical replicates each. Error bars indicate standard deviations. Results were analyzed by one-way ANOVA (p < 0.05). (c) Representative fluorescence microscopy photographs of aniline blue staining of callose deposition in A. thaliana Col-0 or atgrp-3 leaves infiltrated with 2.5 µM HrpE, Trx (control), Xcc at 107 cfu/mL or 15 mM NaCl (mock) 8 hpi (Bar indicates 20 μm). The right panels show the quantification of callose intensities of HrpE and Xcc (darker bars) relative to controls (lighter bars). (d) Representative photographs of DAB stained leaves infiltrated as in (c) (Bar indicates 20 μm). In A. thaliana, H2O2 production is observed as brown precipitates in leaf tissues. The right panels show the quantification of DAB staining of HrpE (darker bars) relative to controls (lighter bars). For both callose and DAB intensities quantifications, the means were calculated from 25 photographs obtained from different treated leaves from three independent experiments. Error bars indicate standard deviations. Asterisks indicate significant differences based on one-way ANOVA (p < 0.05).
