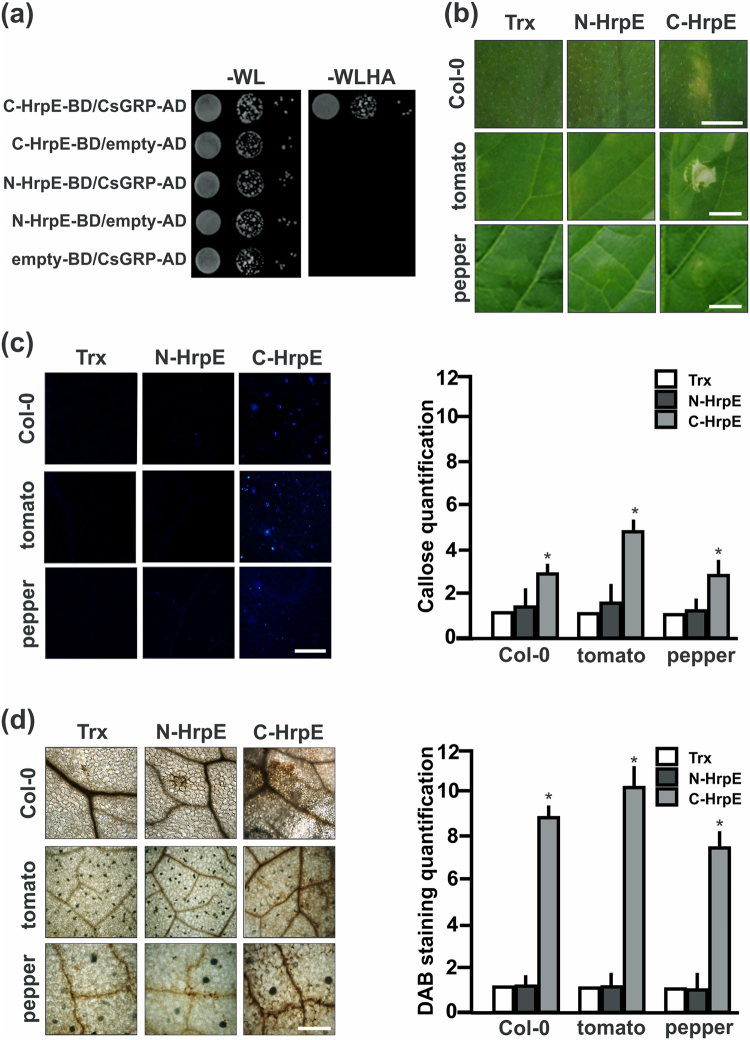
Figure 7.
Analysis of HrpE N- and C-terminal regions in the defense response. (a) Yeast two-hybrid assays of HrpE N-terminal region (N-HrpE-BD) and HrpE C-terminal region (C-HrpE-BD) against CsGRP-AD. Serial dilutions (1:10) of co-transformed yeast were plated on −WL and on −WLHA plates containing 35 mM AT. Co-expression of N-HrpE-BD/empty-AD, C-HrpE-BD/empty-AD and empty-BD/CsGRP-AD were used as controls. (b) Representative photographs of A. thaliana, tomato and pepper plant responses to infiltrations with 2.5 µM N-HrpE, C-HrpE and Trx (control) 16 hpi. Bar indicates 0.5 cm. (c) Representative photographs of callose staining of leaves infiltrated as in (b). Bar indicates 20 μm. Right panel shows the quantification of callose deposits in infiltrated Col-0, tomato, and pepper tissues. Asterisks indicate significant differences based on one-way ANOVA (p < 0.05). (d) Representative photographs of DAB stained leaves, infiltrated as in (b). Bar indicates 20 μm. Right panel shows the quantification of DAB production is these leaves. Asterisks indicate significant differences based on one-way ANOVA (p < 0.05). For both, callose and DAB intensities quantifications, the means were calculated from 25 photographs obtained from different treated leaves from three independent experiments. Error bars indicate standard deviations.

