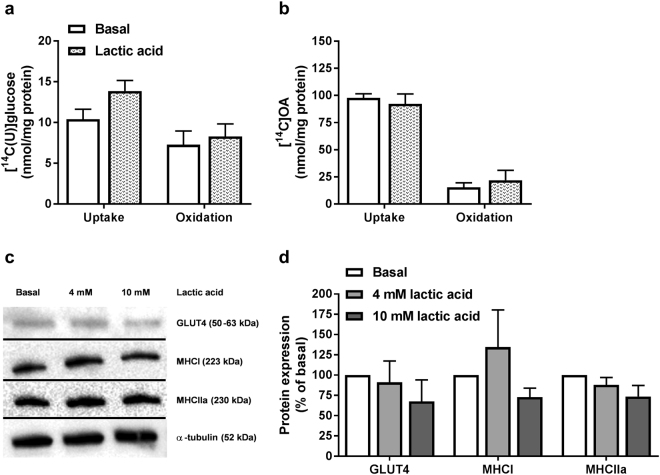
Figure 6.
Glucose and oleic acid metabolism, protein expressions of GLUT4, MHCI and MHCIIa after incubation with lactic acid for 24 h. Myotubes were exposed to 5 mM lactic acid or standard glucose containing media (basal, 5.5 mM) for the last 24 h of the differentiation period. (a) Uptake and oxidation of [14C(U)]glucose (1 µCi/ml, 200 µM) over 4 h. (b) Uptake and oxidation of [14C]oleic acid (OA, 1 µCi/ml, 100 µM) over 4 h. Oxidation was measured as CO2 trapped in a filter and counted by liquid scintillation. Uptake was assessed as the sum of oxidized (trapped CO2) glucose or oleic acid and remaining cell-associated (CA) radioactivity. Data are presented as means ± SEM relative to basal (n = 3). (c,d) Protein expressions of GLUT4, MHCI and MHCIIa assessed by immunoblotting. (c) One representative immunoblot. (d) Quantified immunoblots relative to basal. All values were corrected for the housekeeping control α-tubulin, and data are presented as means ± SEM relative to basal (n = 5). Dividing lines delineate blots from different gels. The samples derive from the same experiment, and all blots were processed in parallell. Full-length blots are presented in Supplementary Fig. 6.

