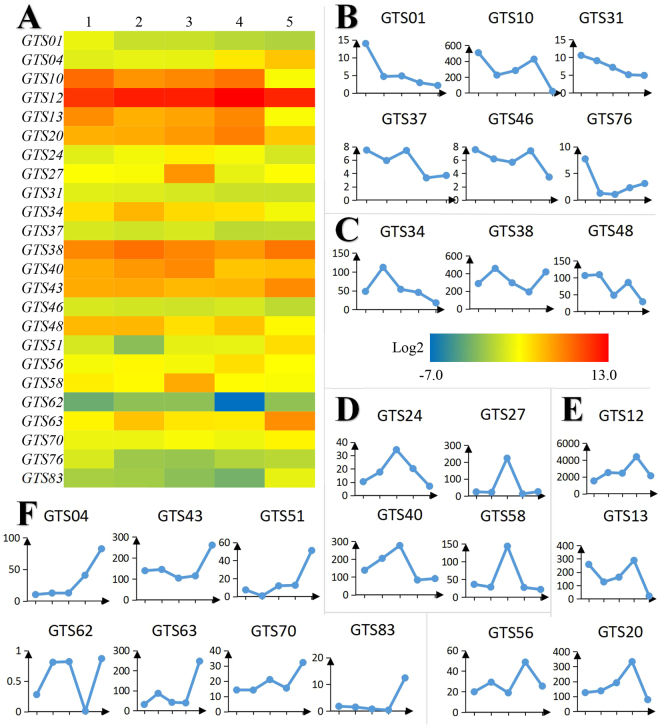
Figure 2.
The expression profile of putative genes related to gallotannin biosynthesis. (A) The heatmap of expression profiles of 24 representative genes expressing profile in different developmental stage of gallnut. The horizontal 1–5 are five time point in Jun. 21, Jul. 26, Aug. 8, Aug. 18 and Oct. 12 respectively; (B–F). The different gene expression profiles of putative genes related to gallotannin biosynthesis. The different type of GTS genes peaking on June, July, August, September and October are list in (B,C,D,E and F), respectively. The vertical number represents RPKM for each GTS gene.

