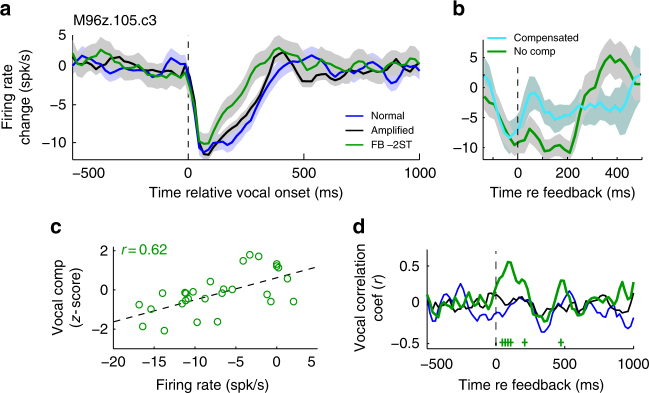
Fig. 3.
Neural prediction of vocal compensation. a A sample multi-unit (MUA) PSTH of a single recording site is shown in response to a −2ST shift. b Splitting feedback responses into compensated and no compensation trials (vocal compensation z-score > 0 vs. <0) showed an early increase in activity during compensated trials that preceded vocal compensation (which occurs >200 ms). c Correlation between feedback responses (0–200 ms) and future vocal compensation (>200 ms, r = 0.62, p < 0.001). Linear regression fit is shown (dashed). d Sliding-window analysis showed that this correlation did not develop until after feedback onset and lasted until the start of vocal compensation (+p < 0.05). Sample sizes and statistical details may be found in the Supplementary Note 1

