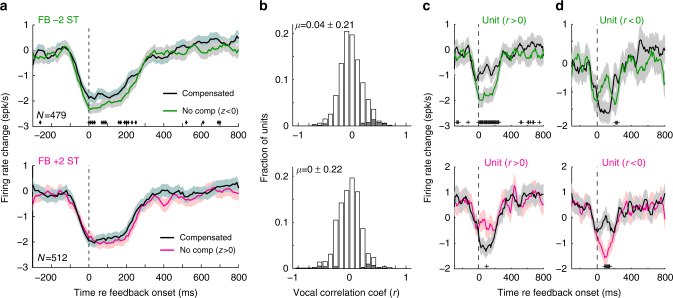
Fig. 4.
Populations responses preceding vocal compensation. a Population average PSTHs showing differences between compensated and non-compensation trials for FB −2ST (top) and +2ST (bottom) in suppressed units (RMI ≤ −0.2). Number of units are indicated (Error bars: SEM; +p < 0.05, Kruskall–Wallis). b Population distribution of individual unit vocal correlation coefficients showing variability between units (Shaded: p < 0.05). Mean ± std (standard deviation) indicated. c, d, Population PSTHs after splitting units between those with vocal correlation coefficients r > 0 (c) and r < 0 (d). PSTHs show differential activity starting after the onset of altered feedback. Differences were noted to be stronger for units whose correlation coefficients predicted the expected behavioral compensation (bolded) during altered feedback: r > 0 for FB −2ST (c, top) and r < 0 for +2ST (d, bottom), as evidenced by the presence of significantly different time bins (p < 0.05; −2ST: 23 significant time bins in the 250 ms for r > 0 vs. 3 in r < 0; +2ST: 7 bins for r < 0 vs. 1 for r > 0). Sample sizes and statistical details may be found in the Supplementary Note 1

