Fig. 5.
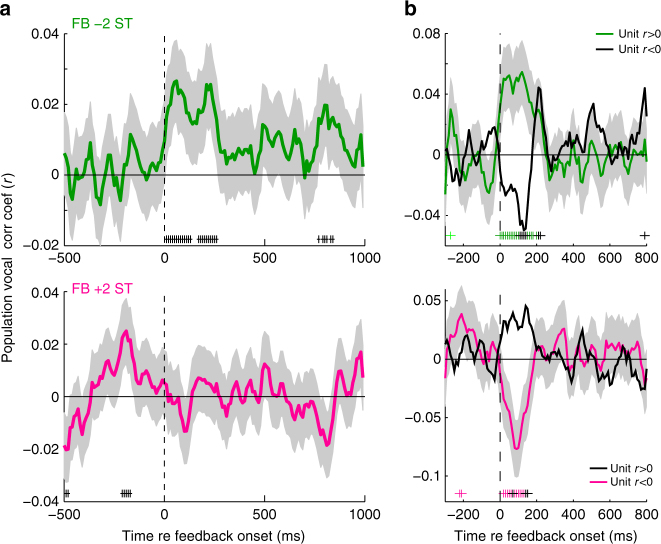
Population correlations between neural activity and vocal compensation. a Population sliding-window correlation analysis showing timing of correlation coefficients between neural firing in different time bins and vocal compensation after 200 ms. Results are shown separately for −2ST and +2ST (Shaded: 95% CI, +p < 0.05). Correlations develop immediately after the start of altered feedback and persist until the time of vocal compensation onset. b Population correlations dividing unit into r > 0 or r < 0, as in Fig. 4. For clarity, error bars have been omitted from the non-compensatory r-value units (i.e., r-values opposite expected vocal compensation for feedback direction). Significant correlations are indicated (+p < 0.05). Sample sizes and statistical details may be found in the Supplementary Note 1

