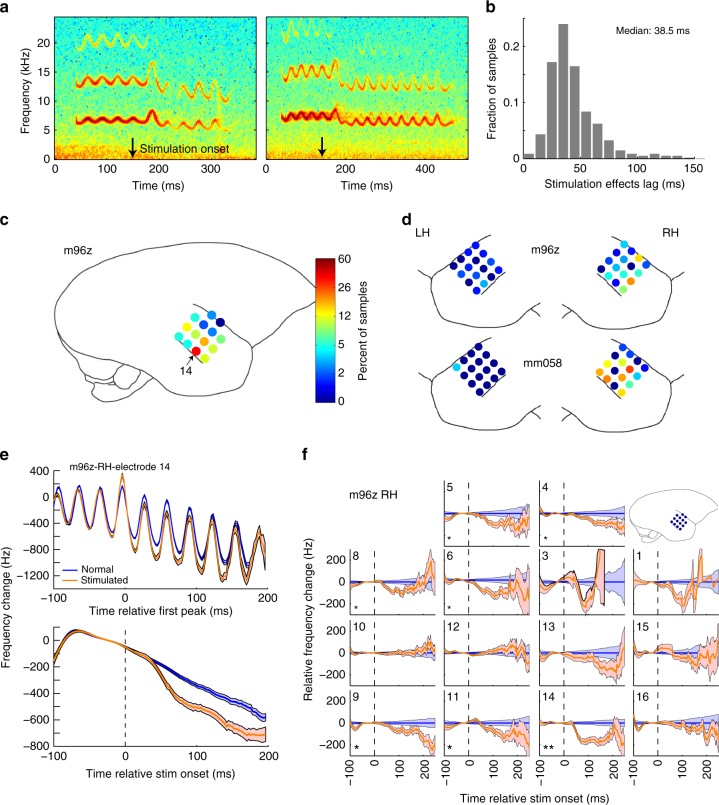
Fig. 7.
Vocal frequency changes during electrical microstimulation of auditory cortex. a Two sample trill spectrograms showing abrupt changes in vocal frequencies shortly following stimulation onset (arrows). b Distribution of timing latency between stimulation onset and vocal changes demonstrating rapid stimulation effects. c Spatial distribution of stimulation effects (percent of trill samples demonstrating frequency changes) in one right hemispheric electrode array. Indicated electrode locations are approximate. d Stimulation distribution for two additional left (LH) and right (RH) hemispheric arrays in two animals. Color scale is identical to c. e Vocal contours for a single stimulation site (indicated in c) comparing normal and stimulated mean frequency curves aligned either by the first trill peak after stimulation (top), or smoothed curves aligned by stimulation onset (bottom), demonstrating onset peak and rapid reduction (Error bars: SEM). f Vocal frequency contours for a right hemisphere grid (m96z-grid in c) demonstrating a mix of electrodes with strong stimulation effects and others with weak to absent changes. (*p < 0.05, **p < 0.001, Wilcoxon signed-rank)

