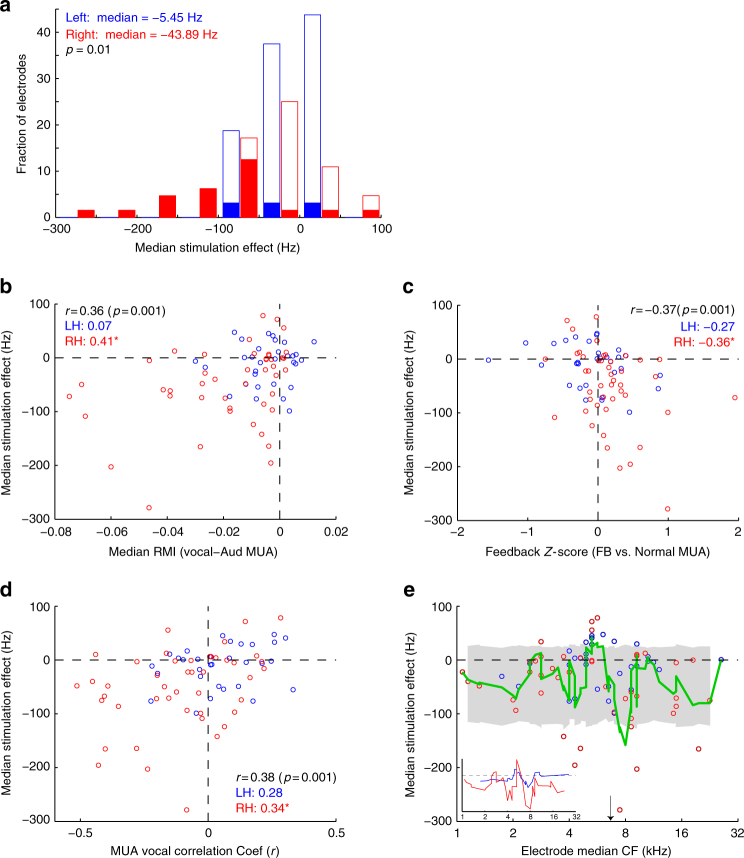
Fig. 9.
Correlation between neural recording and microstimulation effects. a Histogram of median vocal frequency changes during microstimulation for each electrode site (Shaded: p < 0.05, Wilcoxon signed-rank within electrode). Results are plotted separately for right and left hemispheric electrodes, with stronger effects on the right (p = 0.01, Wilcoxon rank-sum between hemispheres). b Scatter plot comparing stimulation effects and the degree of vocal suppression (vocal-auditory RMI) of multi-unit activity (MUA) at the matched recording site. Significant correlations were present for the population, as well as in the right hemisphere (*p < 0.01), but not left hemisphere. c Scatter plot showing negative correlation between stimulation and feedback sensitivity. d Plot comparing microstimulation and vocal compensation correlation coefficients. Sites with negative neural-vocal correlations showed greater decreases in vocal frequency during stimulation, with positive correlation sites showing the opposite. e Comparison of microstimulation effects by electrode frequency tuning, demonstrating largest decreases clustered around 8 kHz, just above mean trill frequency (arrow), and increases around 5–6 kHz, just below mean trill frequency (Green: moving average; shaded: 95% CI). Inset: moving average curves separated by right (red) and left hemispheres (blue)

