
Figure 1.
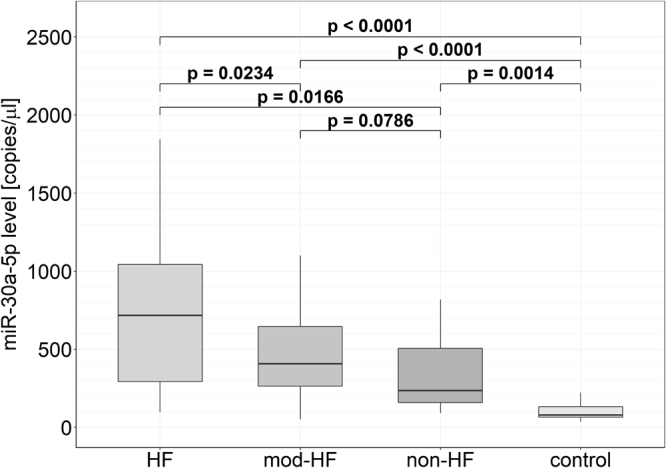
Levels of miR-30a-5p in serum samples from HF, mod-HF, non-HF and CAD control groups. Box plots show the levels of miR-30a-5p measured by ddPCR and expressed in copies per microliter of serum. The bottom and top of each box represents the 1st and 3rd quartiles of the data, respectively. The median (HF: 787.6 [348.8, 1216.0], mod-HF: 407,4 [264.0, 645.3], non-HF: 235.8 [159.9, 505.6], CAD: 79.2 [65.5, 133.2]) is shown as a solid line across the box.