Figure 2.

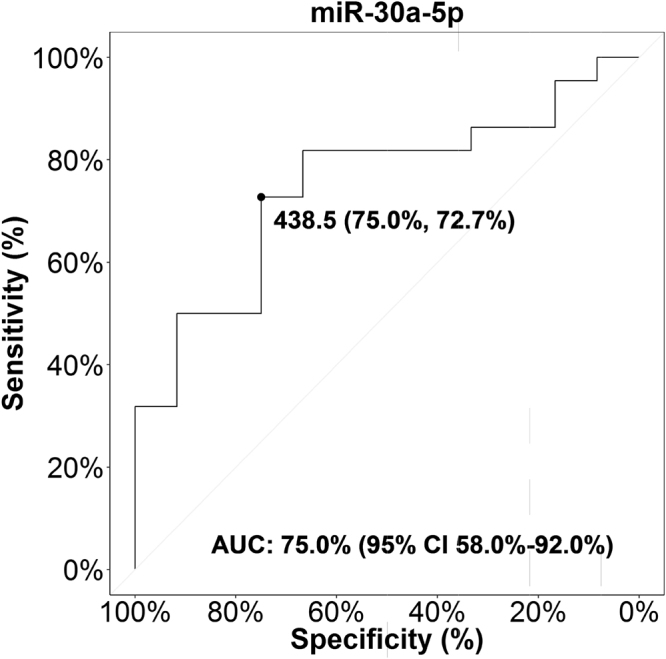
ROC curve for miR-30a-5p. ROC curve analysis of miR-30a-5p level in serum (copies/µl) of n = 22 HF and n = 12 non-HF patients. AUC, area under the curve; CI, confidence interval; ROC, receiver operating characteristic.

ROC curve for miR-30a-5p. ROC curve analysis of miR-30a-5p level in serum (copies/µl) of n = 22 HF and n = 12 non-HF patients. AUC, area under the curve; CI, confidence interval; ROC, receiver operating characteristic.