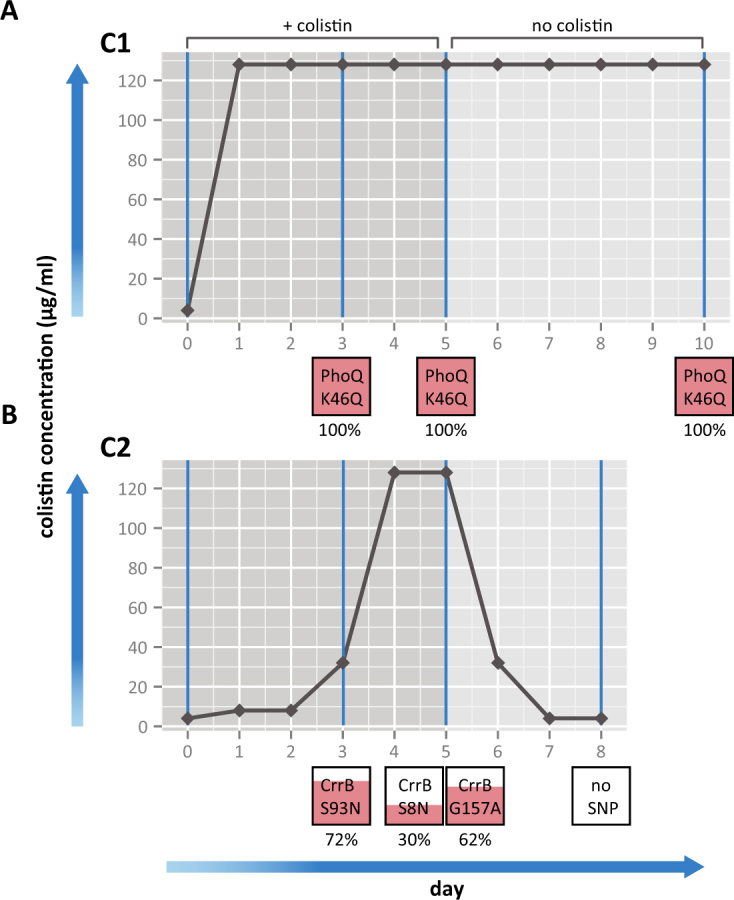
Figure 1.

Bacterial growth with exposure to colistin sulfate and SNPs obtained at each day. The amount of bacterial growth on solid media was observed over a range of colistin concentrations (0–128 μg/ml) for 2 cultures of Ecl8 over 8–10 days for C1 (A) and C2 (B). The horizontal black lines represent bacterial growth on different concentrations of colistin over a 5 day time period, then growth after colistin selection is removed for another 5 days or until colistin sensitivity was reached. The boxes below represent the SNPs identified in each culture at D3, D5 or D10 and the amount of pink fill represents the proportion of the population harboring the SNP and this number is displayed below.
