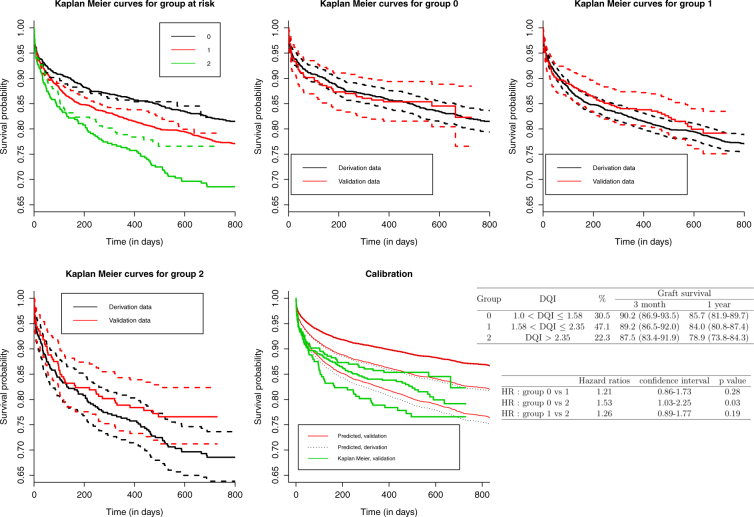
Figure 3.
Survival curve using Kaplan Meier estimate for the three risk groups of the DQI score in the derivation (solid lines) and validation (doted lines) datasets. Predicted survival curves in the derivation and validation dataset using the PI and the baseline survival in the derivation dataset with the estimated survival using Kaplan Meier curves in the validation dataset. Graft survival at month 3, year 1 and 3, estimated using Kaplan Meier and hazard ratios through DQI risk groups for validation data.

