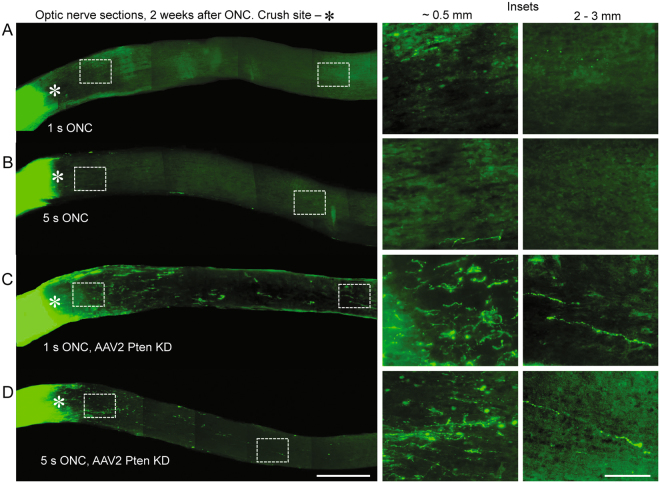
Figure 3.
Axon regeneration stimulated by Pten KD after 1 s or 5 s ONC. (A,B) Representative images of the optic nerve longitudinal sections with CTB-labeled axons through the optic nerve, 2 weeks after 1 s (A) or 5 s (B) ONC. (C,D) Representative image of the optic nerve longitudinal sections with CTB-labeled axons regenerating through the optic nerve, 2 weeks after 1 s (C) or 5 s (D) ONC and pre-treatment with anti-Pten shRNA AAV2. The edges of the tissue were cropped out due to artefactual autofluorescence that is common at tissue edges. Insets: Representative images of the optic nerve regions proximal and distal to the injury site are magnified for better visualization of the axons or their absence. Scale bars, 500 µm (main panels), 100 µm (insets).

