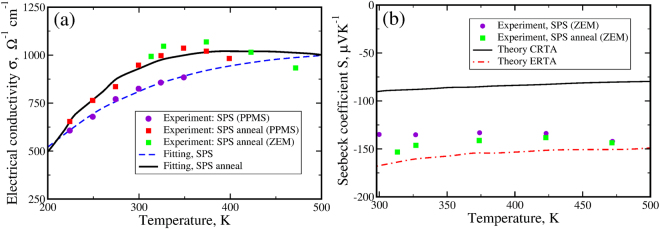
Figure 3.
Panel (a): Temperature variation of the electrical conductivity σ measured in the experiment in n-type samples before (violet circles) and after (red and green squares) annealing. The fitting curves are shown by dashed blue and solid black lines respectively. Panel (b): Temperature variation of the Seebeck coefficient S for n-type samples measured in experiment (violet circles and green squares). The theoretical Seebeck coefficients calculated in the CRTA and in the ERTA are shown by black solid and red dashed dotted lines respectively. We have used ZEM and PPMS systems for the measurements.

