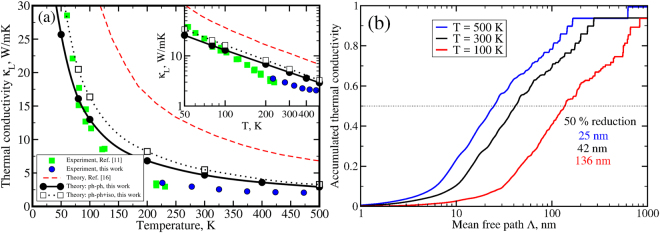
Figure 5.
Panel (a): Temperature dependence of the thermal conductivity calculated with account for anharmonic three-phonon processes only (black dashed line) and with addition of isotopic disorder scattering (black solid line); green squares - experimental data from Whitsett et al.11; blue circles - our experimental data; dashed red curve - previous computational result from refs16,32. The thermal conductivity data in log-log scale are shown in the insert. Panel (b): Accumulated thermal conductivity as a function of phonon mean free path Λ at T = 100 K (blue curve), 300 K (black curve) and 500 K (red curve). Horizontal dotted line denotes 50% thermal conductivity reduction.

